Benchmark Results
For performance testing, we ran several popular benchmarks. Using the same components as in our B850 Challenger Wi-Fi review, we were able to make some comparisons. While it’s not a one-to-one comparison, it’s still interesting to see the chipset’s potential influence on performance.
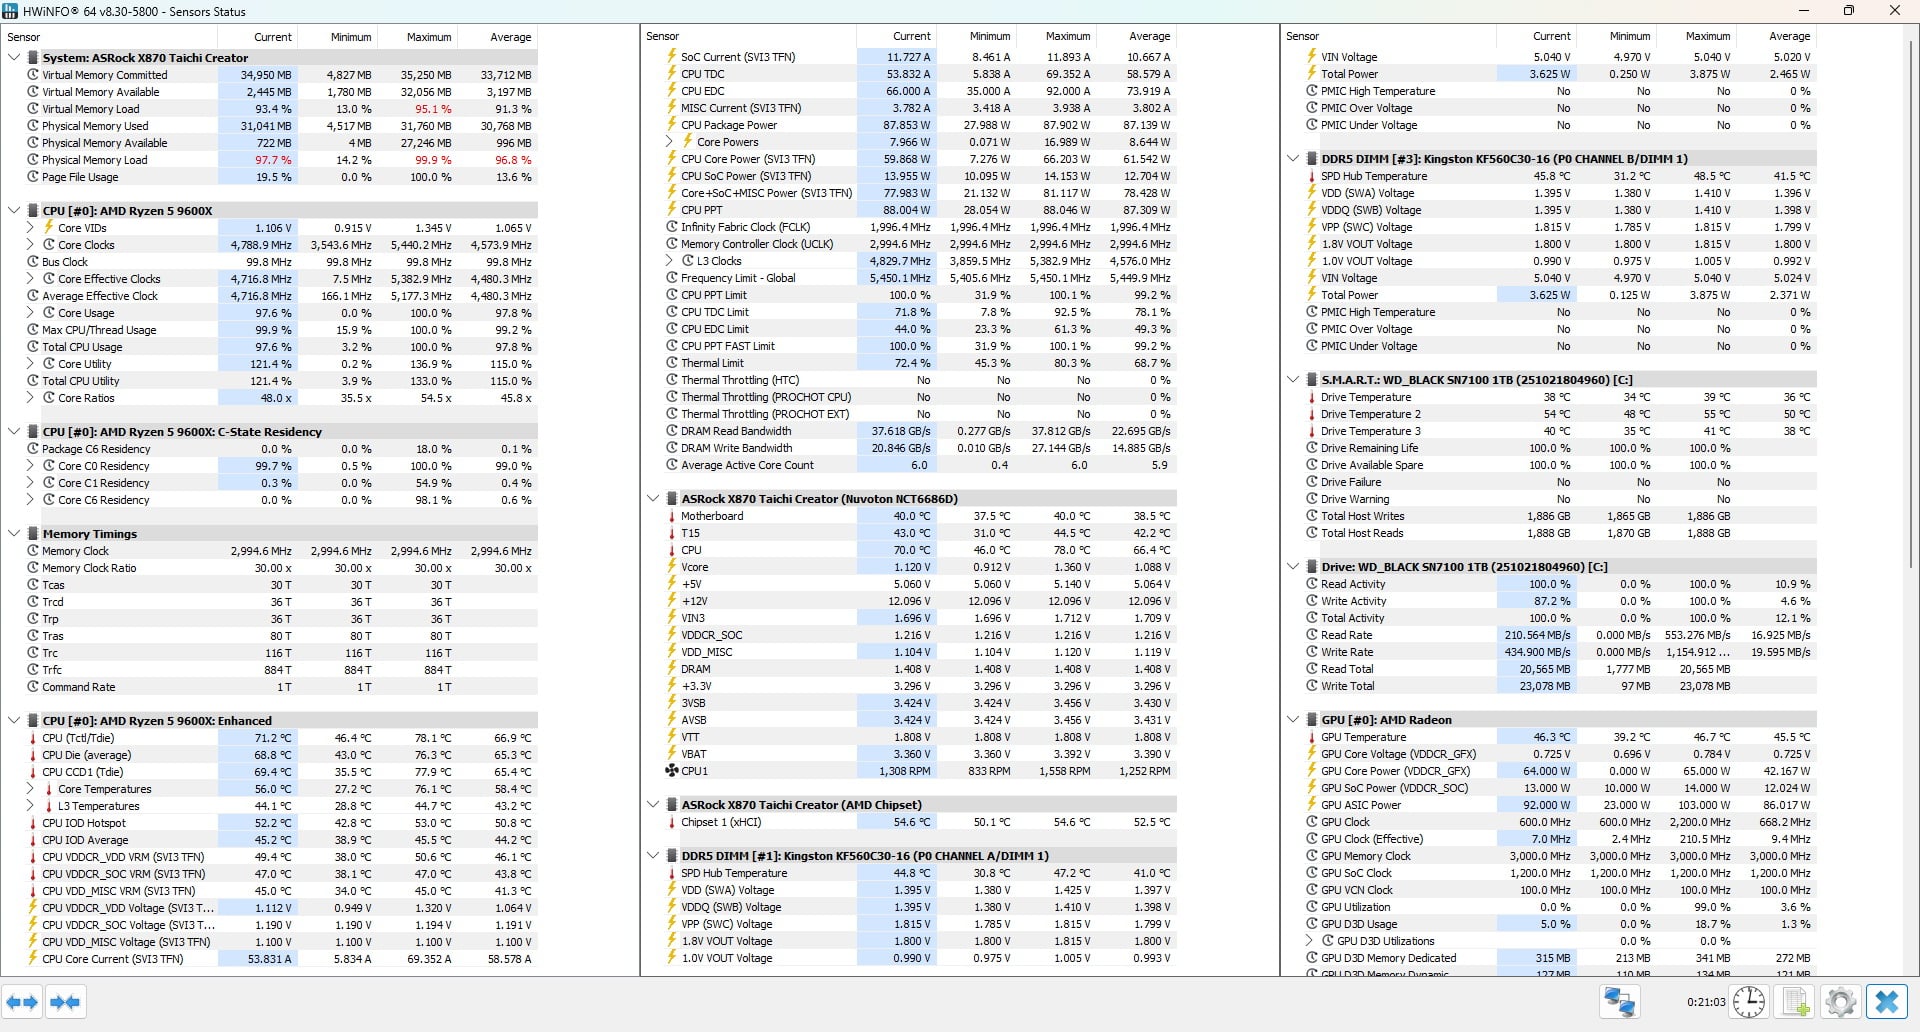
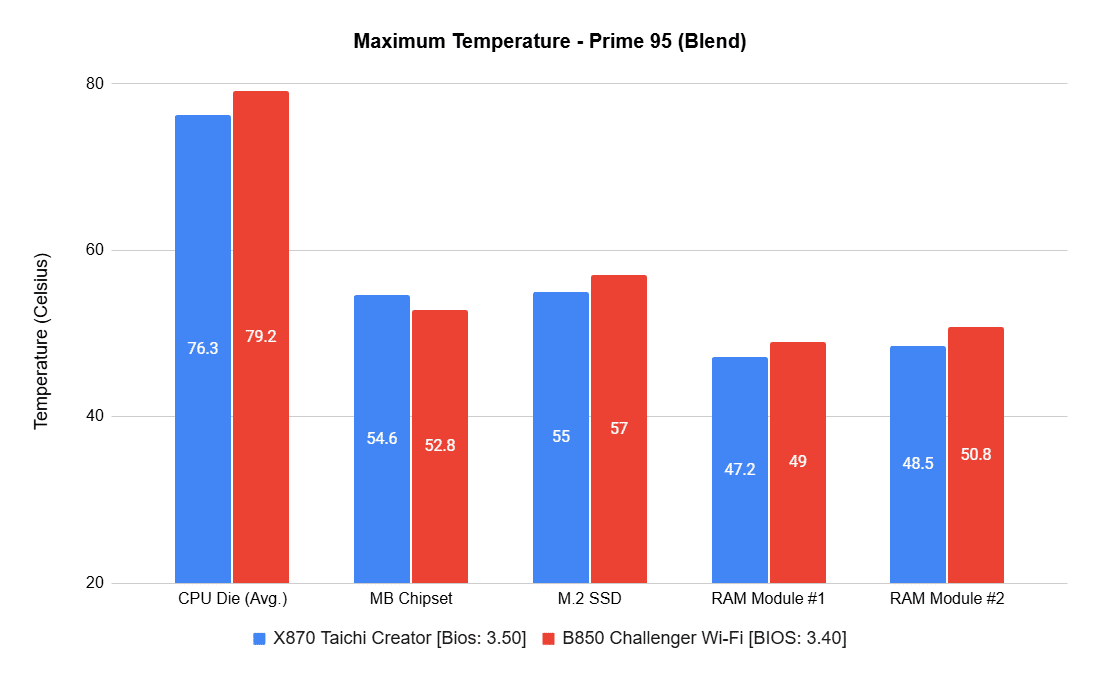
Prime95 is a tool originally designed to find prime numbers, but it has become infamous for pushing computers to their limits, making it perfect for endurance testing. Here, HWinfo was used to track temperatures and power consumption. The board performed as expected.
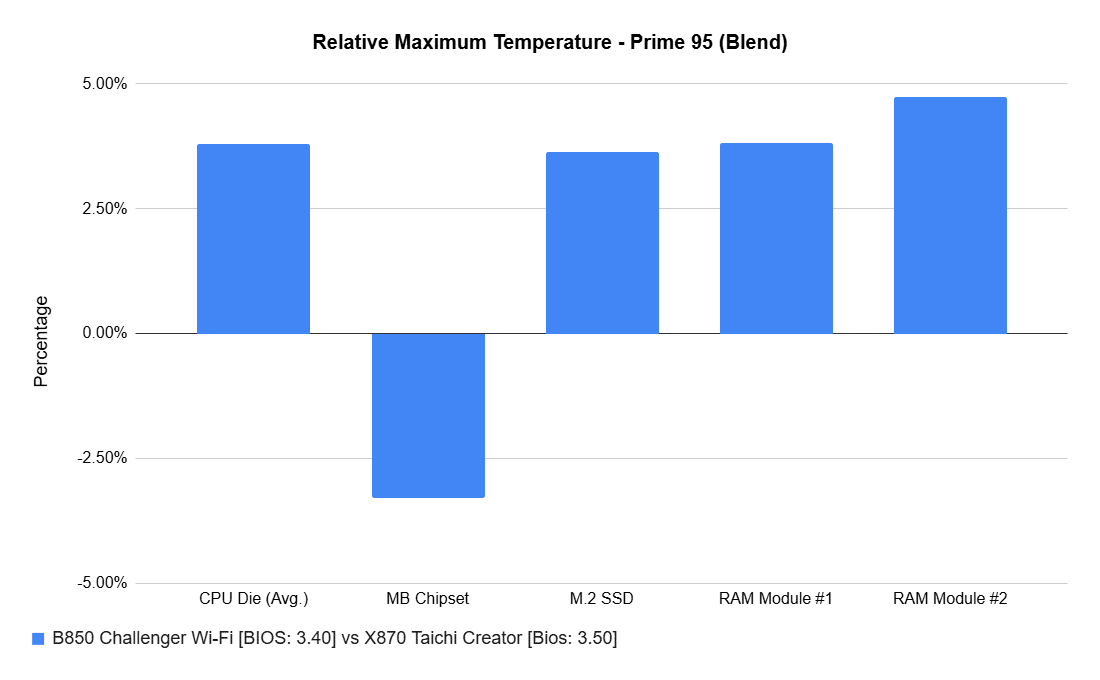
The charts show maximum temperatures on key components, followed by a relative comparison. Aside from the chipset, all hardware was identical. The B850 board ran slightly hotter.
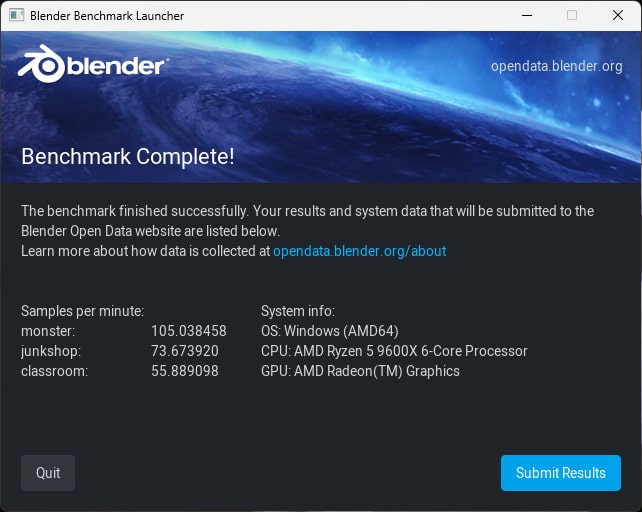
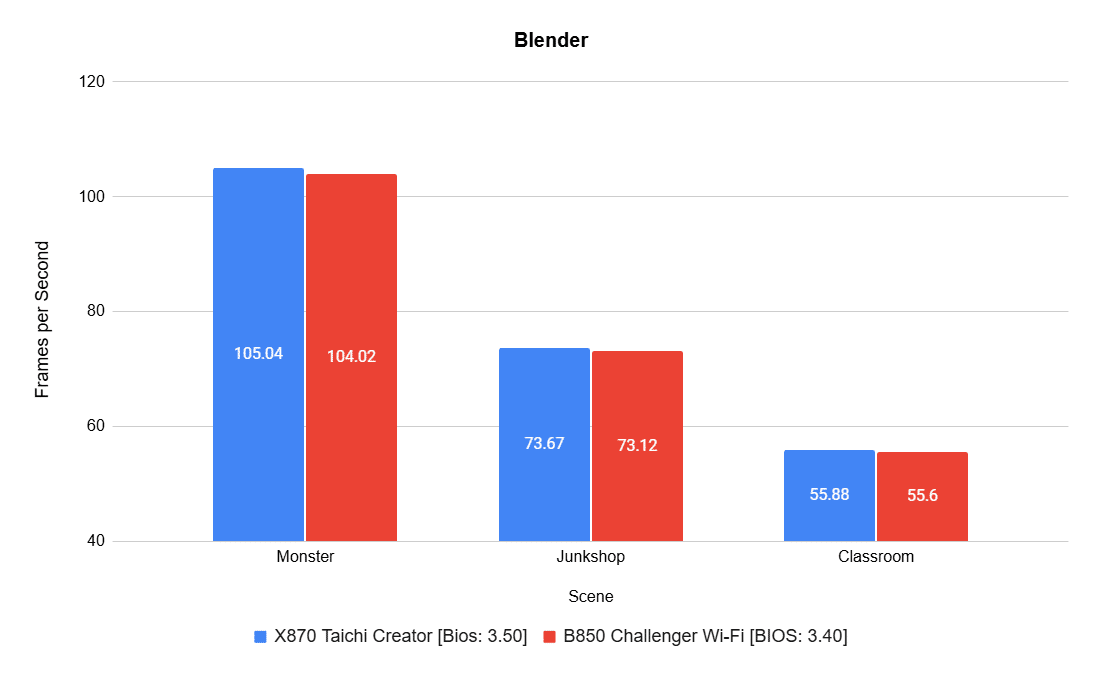
Blender is another test used to evaluate how the motherboard handles sustained, compute-heavy 3D rendering workloads, where VRM design and thermal handling can make a difference. The X870 once again performed well.
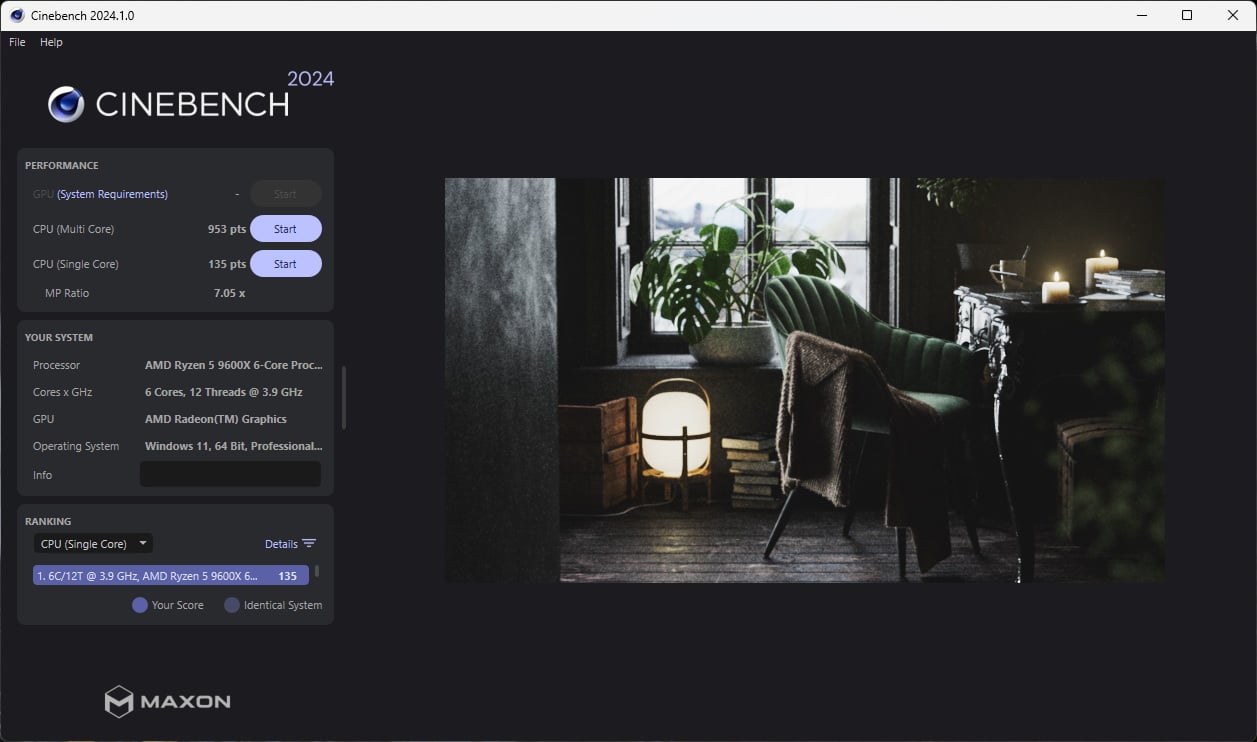
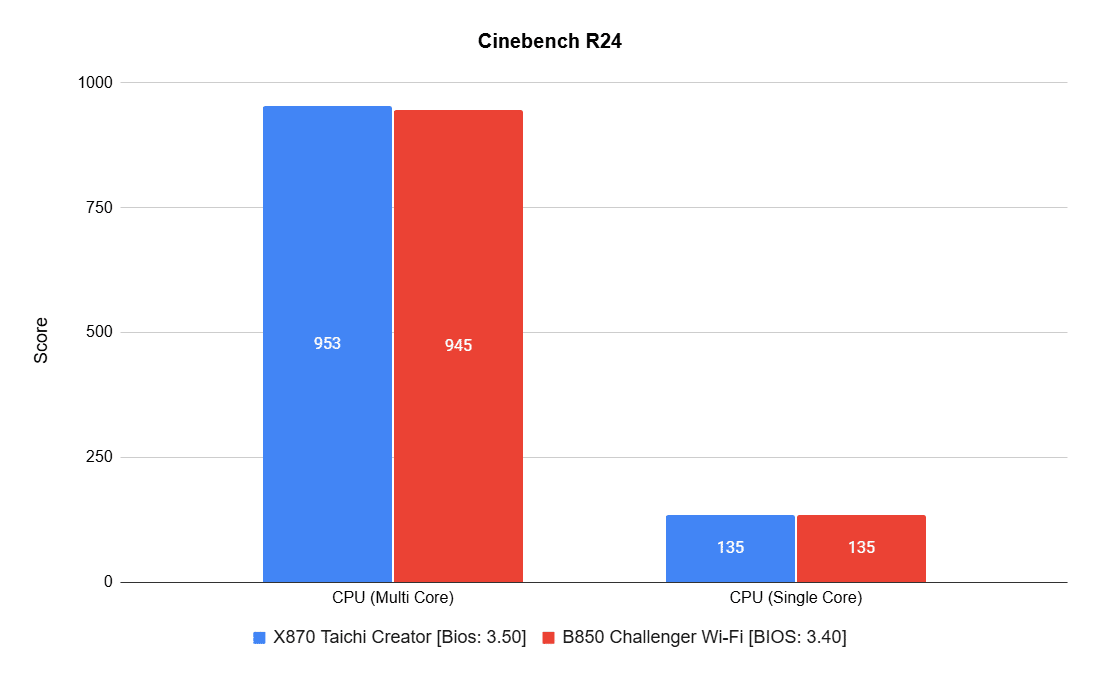
Cinebench R24, powered by the Cinema 4D engine, focuses purely on CPU horsepower. Here, the X870 reached 953 points in multi-core, the highest result we’ve seen from our 9600X so far.
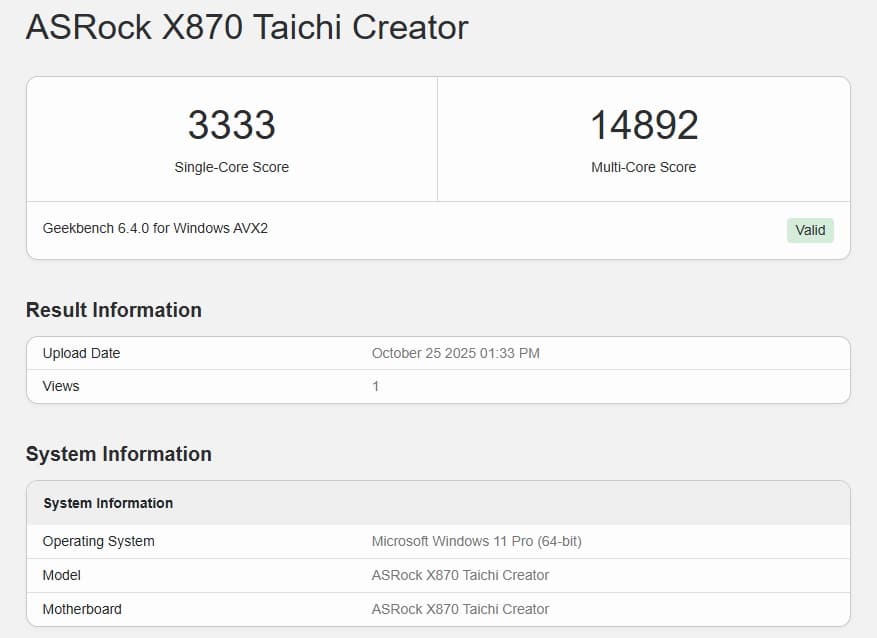
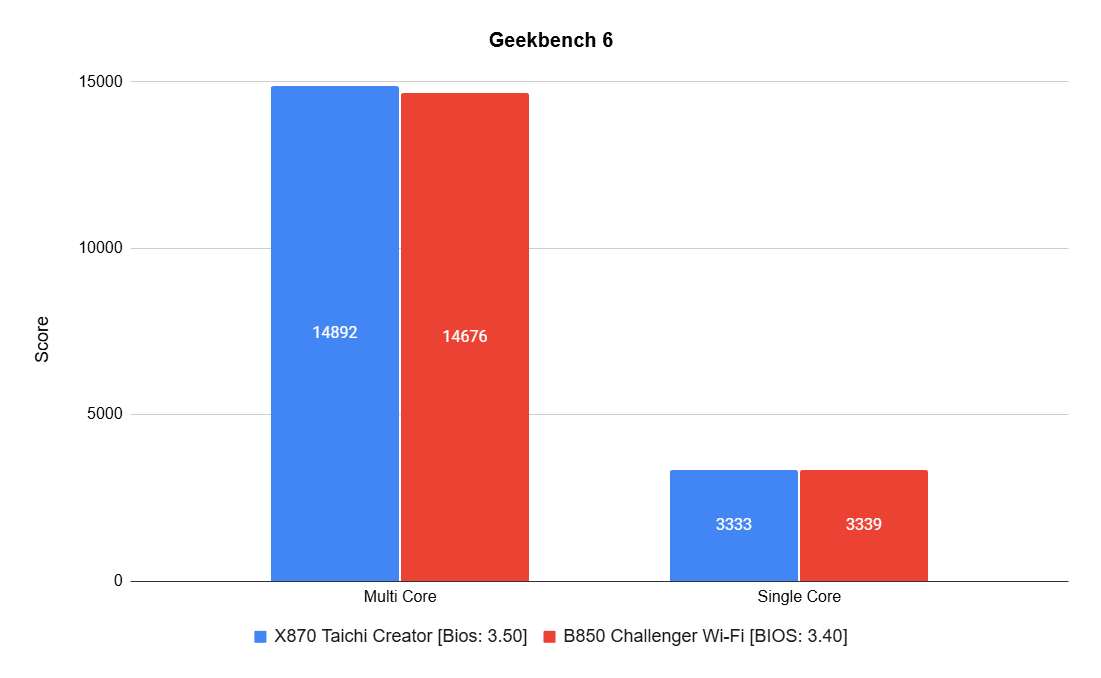
Geekbench 6 covers a wide range of mathematical and real-world tests, including image processing and machine learning. Another helpful feature is the ability to compare performance across different architectures. Once again, multi-core performance improved slightly, while the B850 held a tiny edge in single-core. You can check the X870 results here, and the B850 results here.
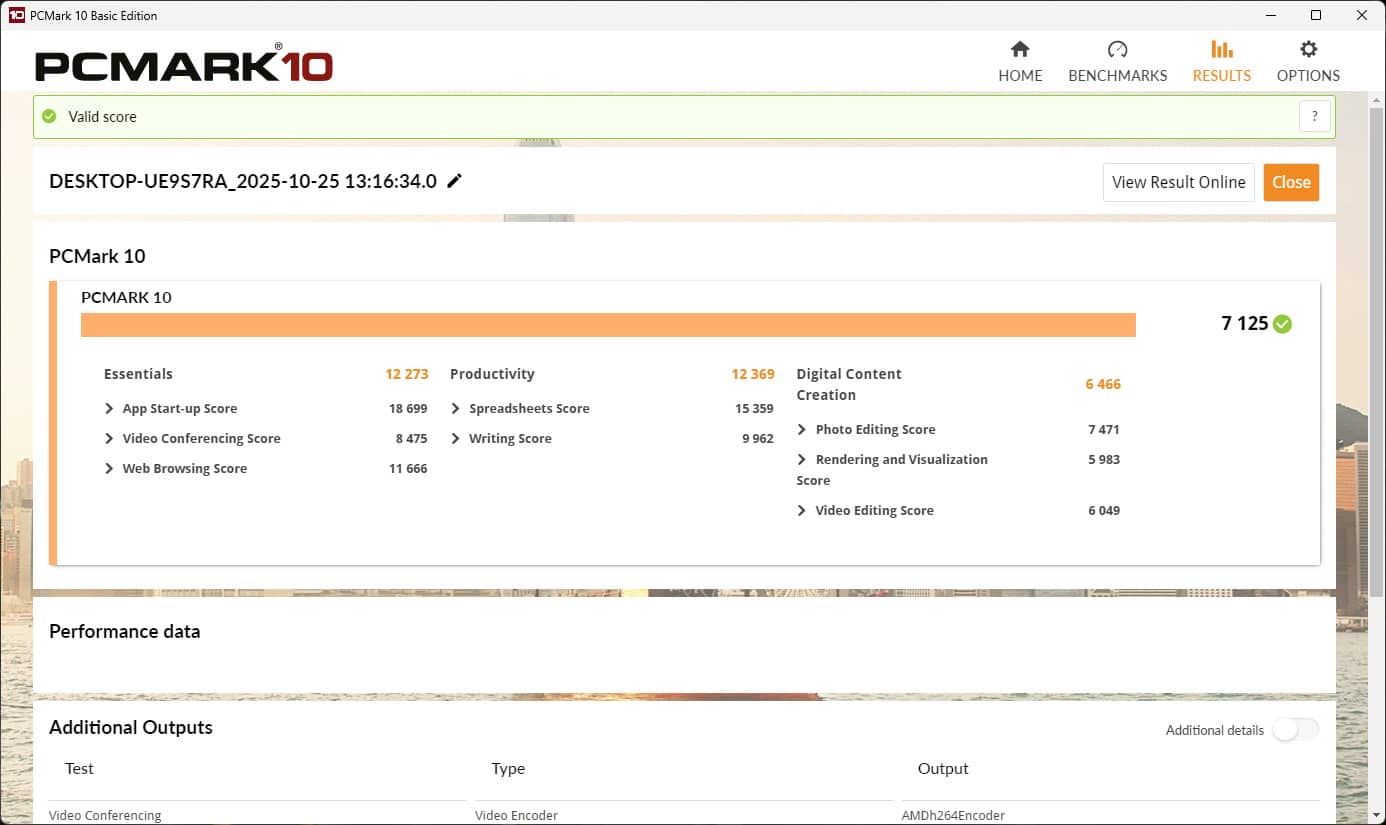
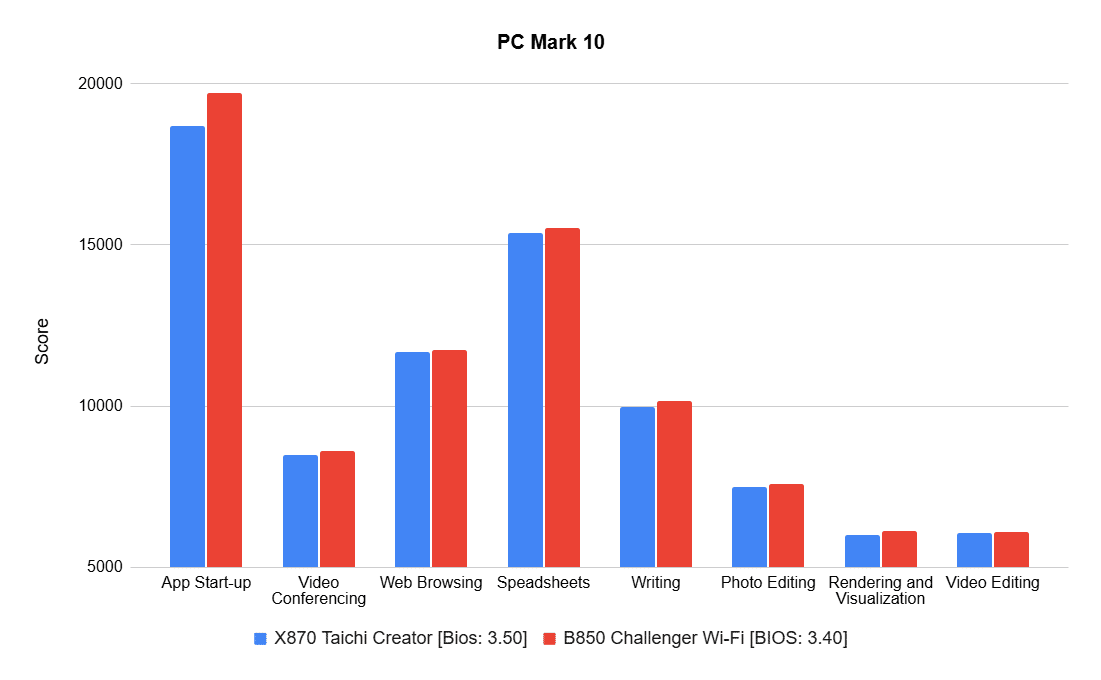
PCMark 10 runs a series of office tasks, web browsing, and creative workflows to represent some of the most common PC tasks.
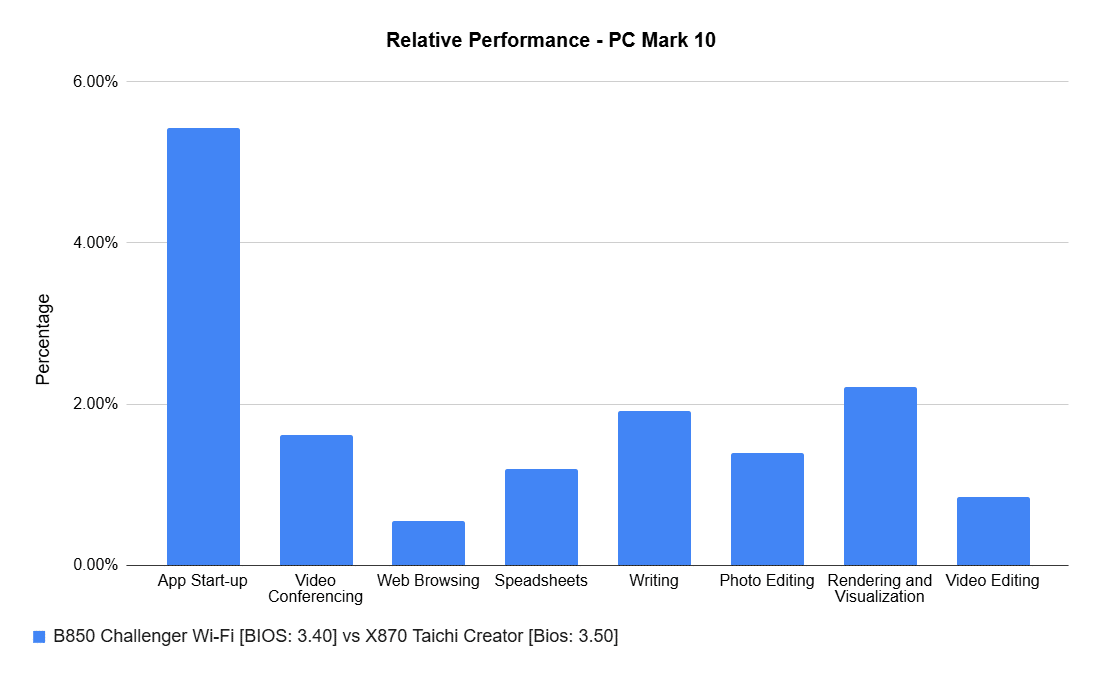
Interestingly, the B850 performed marginally better in some cases; most differences were under 2%, with only app startup showing around a 6% lead. You can access the Creator results here, and the Challenger results here.
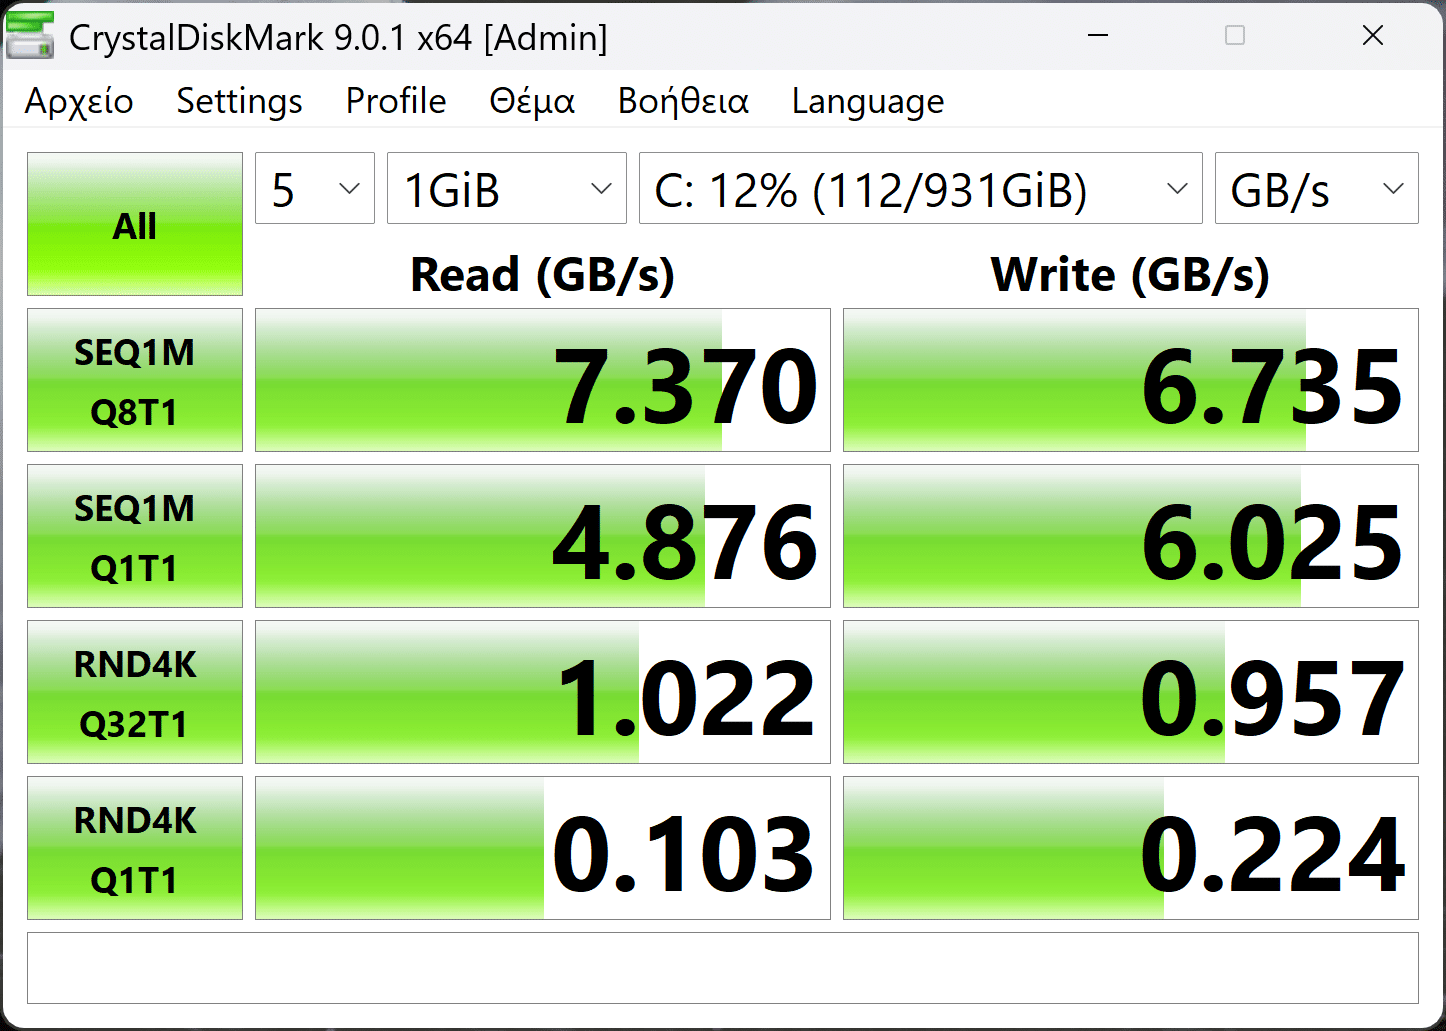
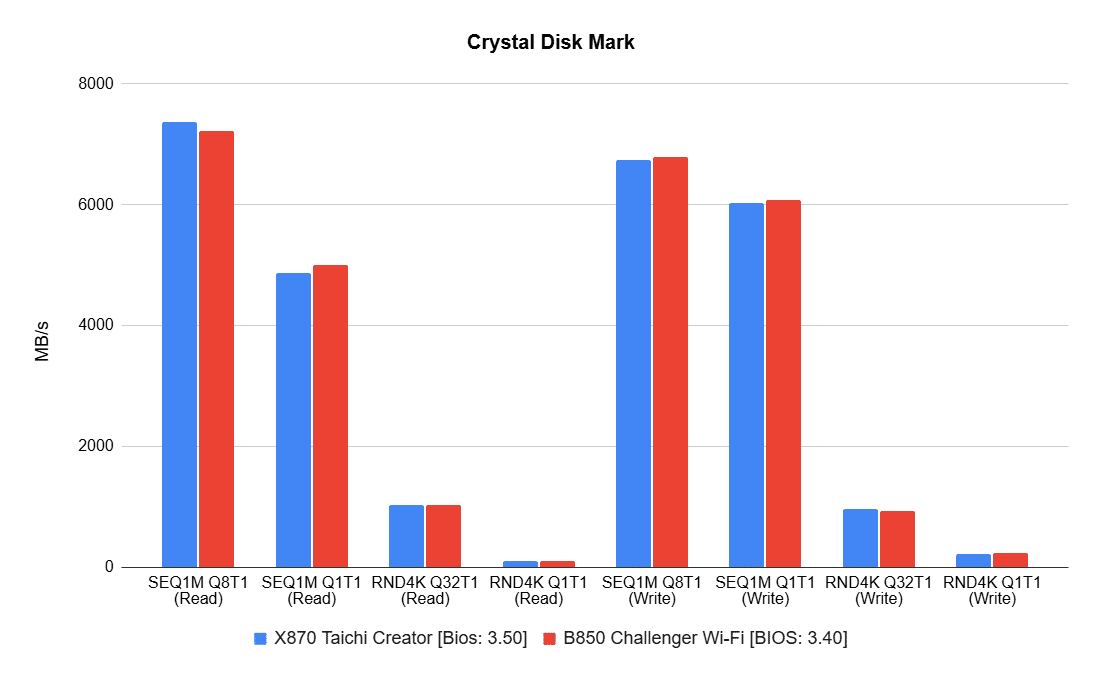
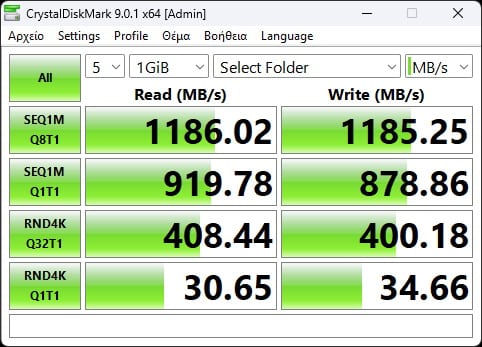
CrystalDiskMark measures storage performance, running sequential and random read/write tests to evaluate how quickly your system can move data, whether you’re loading massive files or thousands of small ones. Keep in mind, the NVMe drive we used is very fast, but not fast enough to saturate the slot.
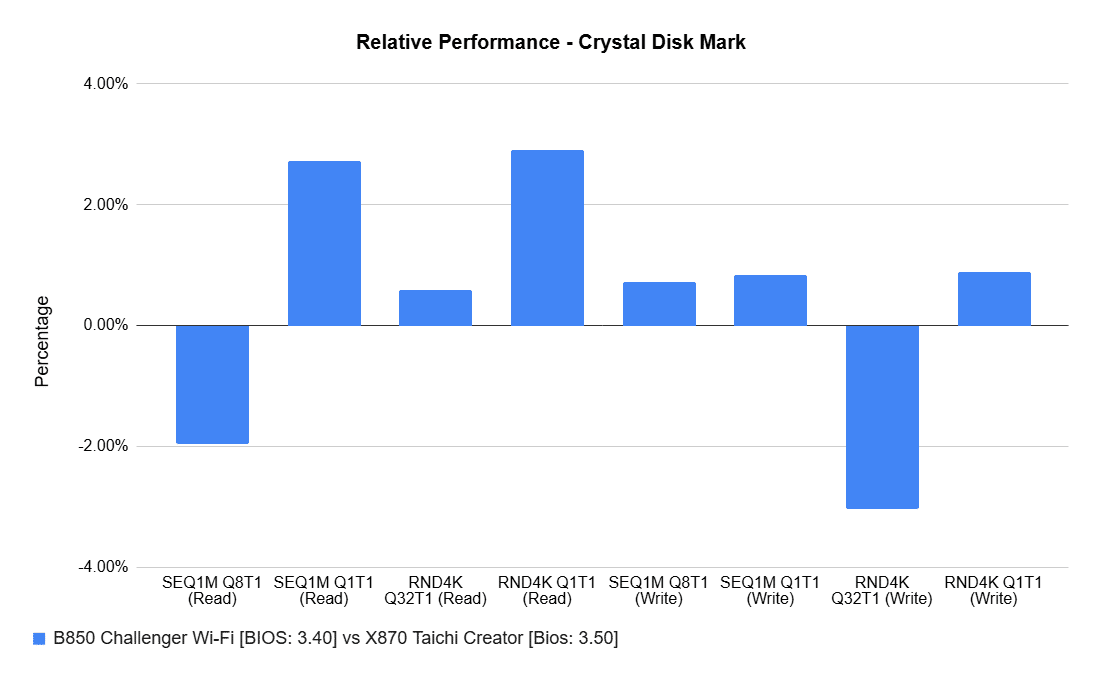
In storage benchmarks, the B850’s SEQ1M Q8T1 and RND4KQ32T1 tests were slower than the X870’s, though the differences weren’t significant.
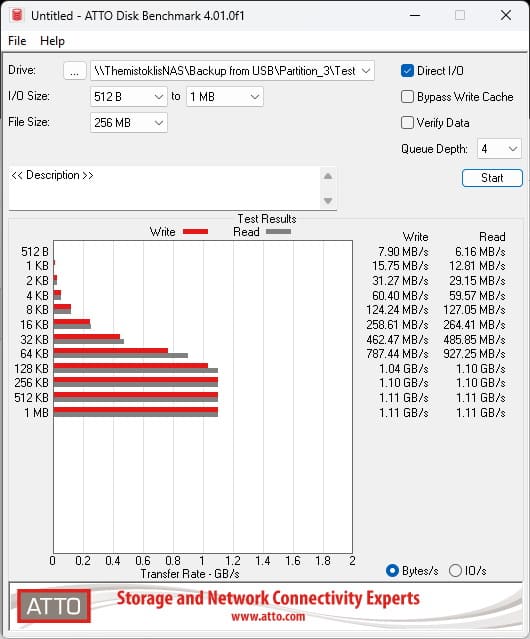
This time, we also tested the 10GbE connection. The motherboard was connected directly to a 10GbE NAS, and file transfers were measured using an M.2 drive installed in the NAS. The results confirmed stable and proper operation.
| Specification | Power Consumption |
|---|---|
| Powered Off | 2.6 W |
| Idle | 47.8 W |
| Full CPU Load | 148.2 W |
Power draw was tested using Prime95’s Small FFTs. The cooler’s ARGB lighting was connected and active. Power consumption with the system off was slightly higher than on previous ASRock models.