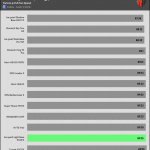
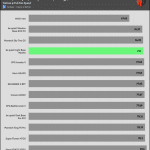
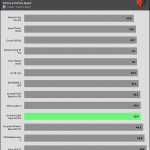
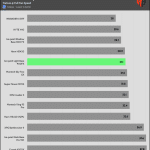
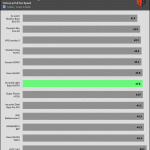
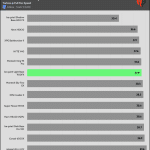
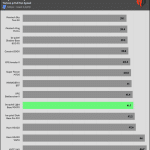
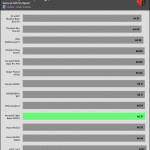
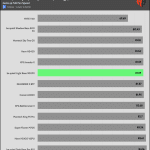
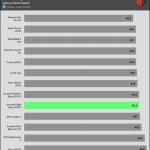
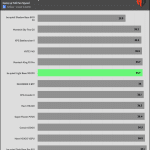
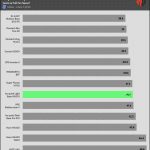
Thermal Performance – Noise Normalized Full Fan Speed
Torture (Prime95 + Furmark) Thermal Results
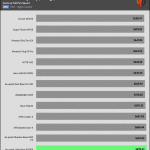
The results are very similar to the 25dBA results. The CPU, VRM, and Chipset temperatures were among the highest.
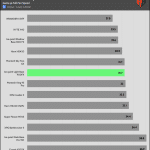
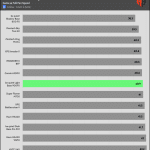
Gaming Results
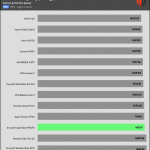
The gaming results did not differ significantly from the torture results. They were overall better.
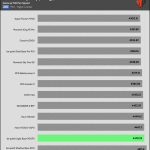
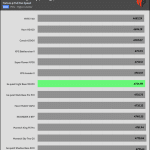
CPU & GPU Average Clock Frequencies
We have to look at the average CPU and GPU clocks to get a complete picture since higher clocks mean more thermal load, which pushes the cooling system more. If we have two cooling systems with only a 1-2 degrees Celsius difference and a 100-200 MHz difference in the clock speeds of the CPU or the GPU, it is easy to find the best performer.
Gaming GPU frequency results were identical to the 25dBA results. The CPU frequency in torture testing was improved.
Pages:

