Benchmark Results
For our performance evaluations, we selected a few of the most well-known benchmarks. Our board was initially paired with a kit of Crucial DDR5 PRO (CL36, 6000MT/s, 1.35V). Given this is an EXPO-compatible kit, we went back to the BIOS to enable it. This change created issues, as Windows kept running into memory errors within the first 5 to 7 minutes of running PRIME 95. Following multiple restarts, it was apparent we had a memory issue.
Back to BIOS, we set the EXPO to 5600MT/s and 1.25V. The system immediately got more stable, but we were not getting all the performance this kit could offer. Seeing that maybe the voltage was the issue, we selected again the first EXPO setting at 6000MT/s but manually lowered all voltages from 1.35V to 1.30V. Following a restart, we got to benchmarking again, and the PRIME 95 issues were solved. We successfully ran all tests, but we can’t promise you’ll have the same experience.
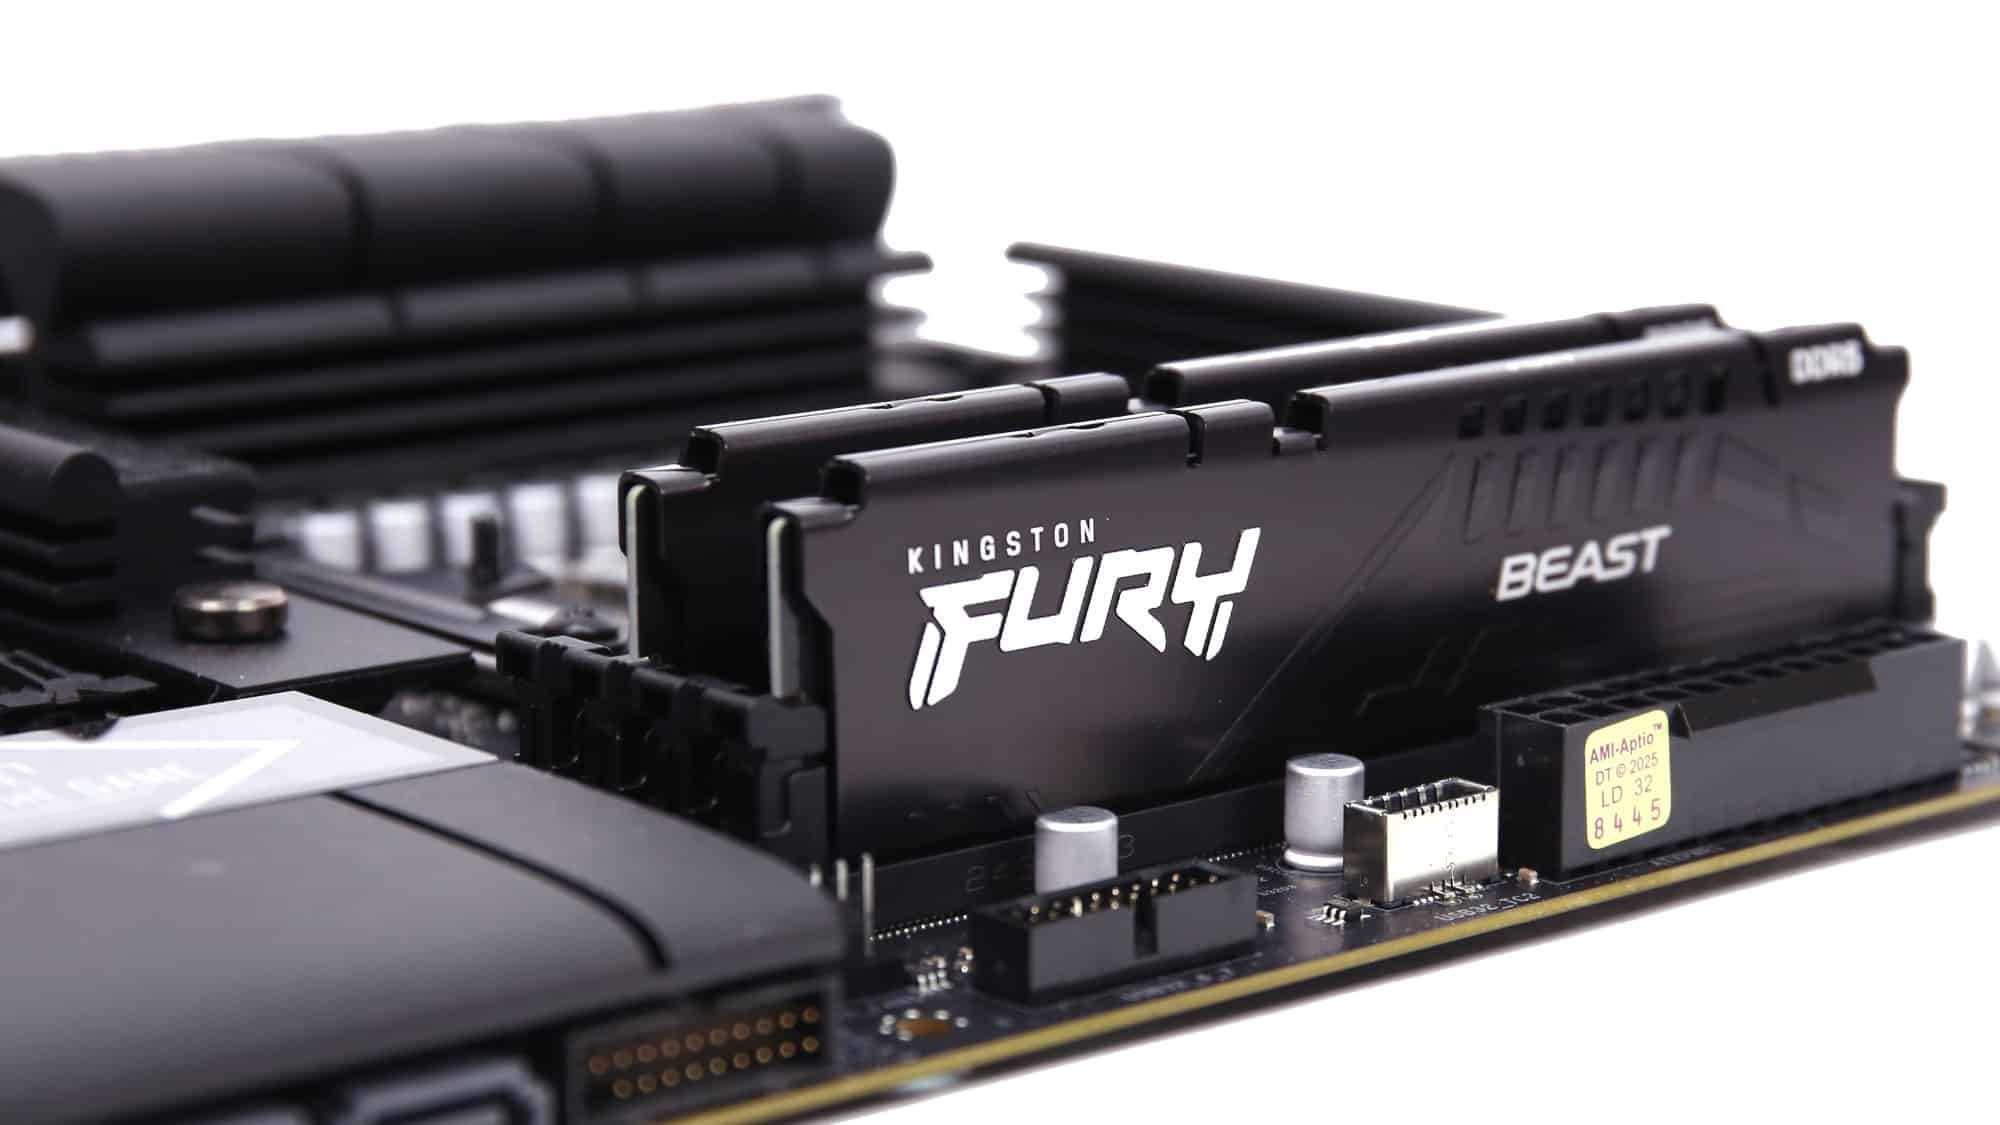
For the sake of confirming that our memory kit was the issue, we also ran all tests with a Kingston Fury set of DDR5 RAM (6000MT/s, 1.4V, CL30). This time, all tests ran smoothly at 1.4V without requiring any intervention. As you will see, the difference in performance wasn’t significant, but the difference in system stability compared to our first try was.
In the following images and charts, you can find results with both the old and new BIOS, as well as some additional runs using the different RAM kits on Prime95 and PCMark 10, both of which are particularly demanding on memory. The Kingston kit was tested on BIOS 3.4.
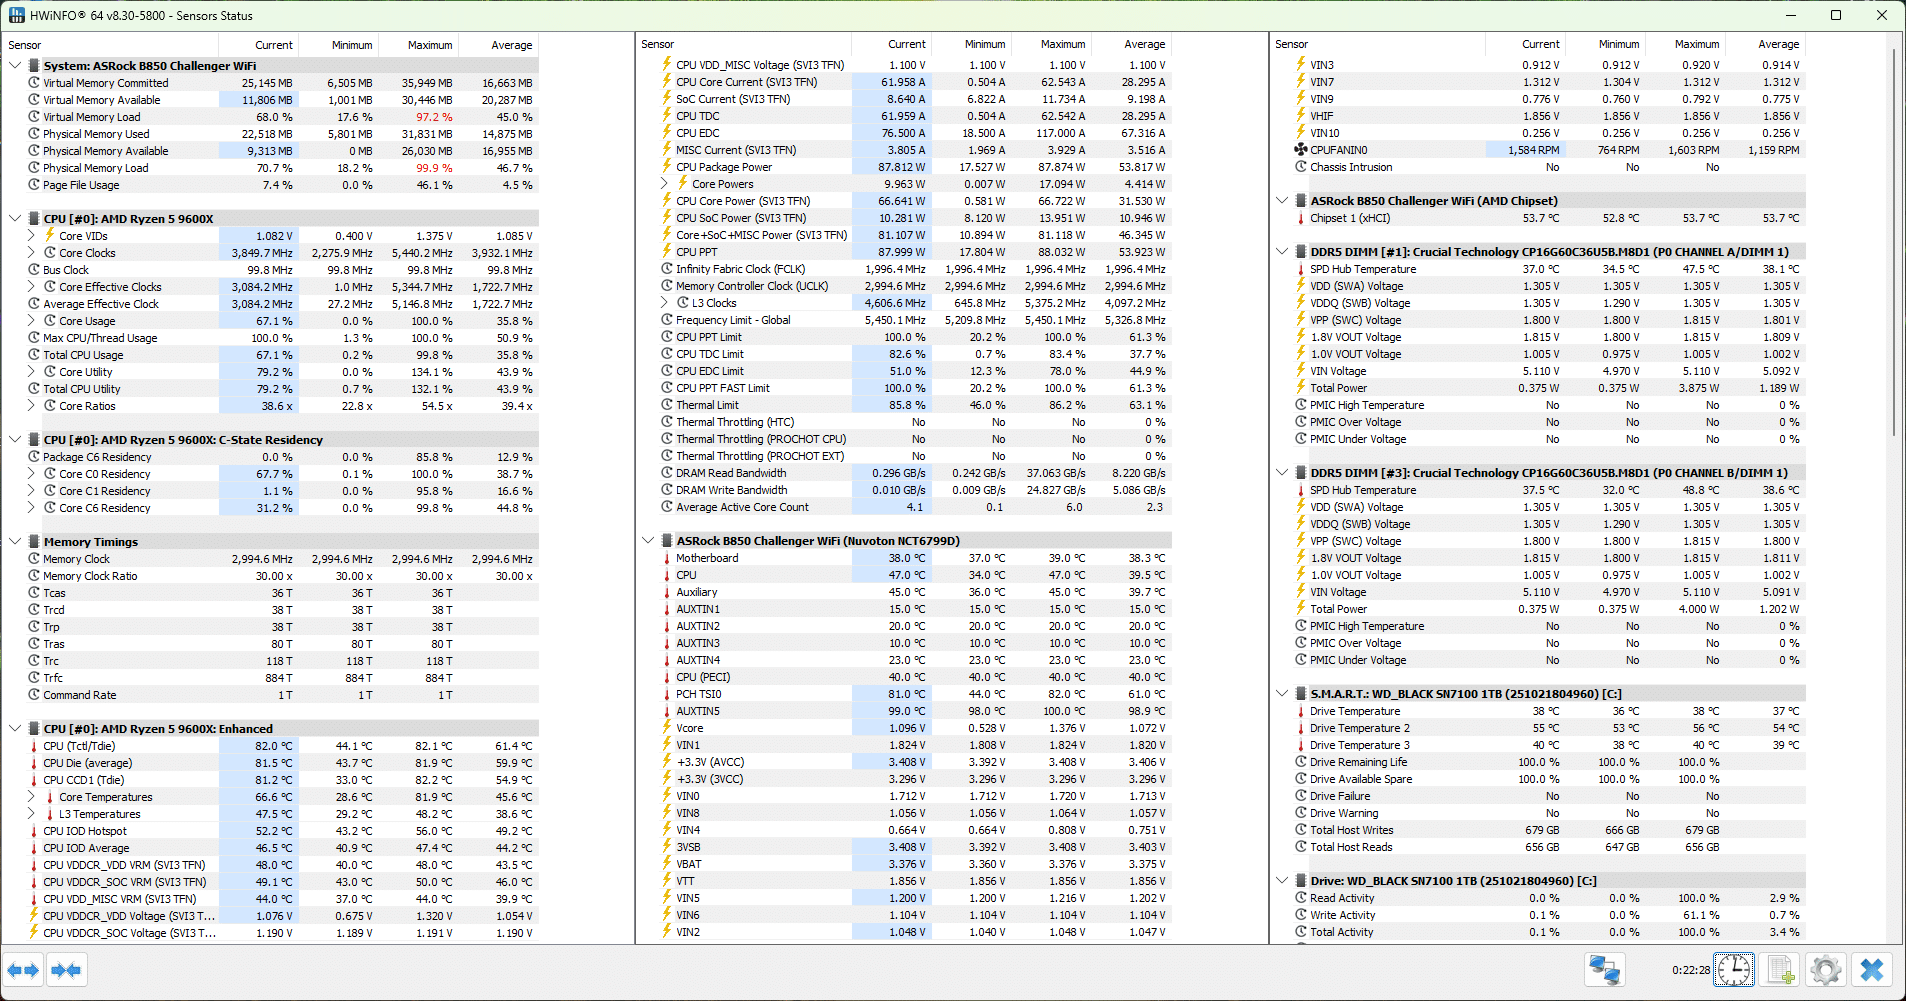
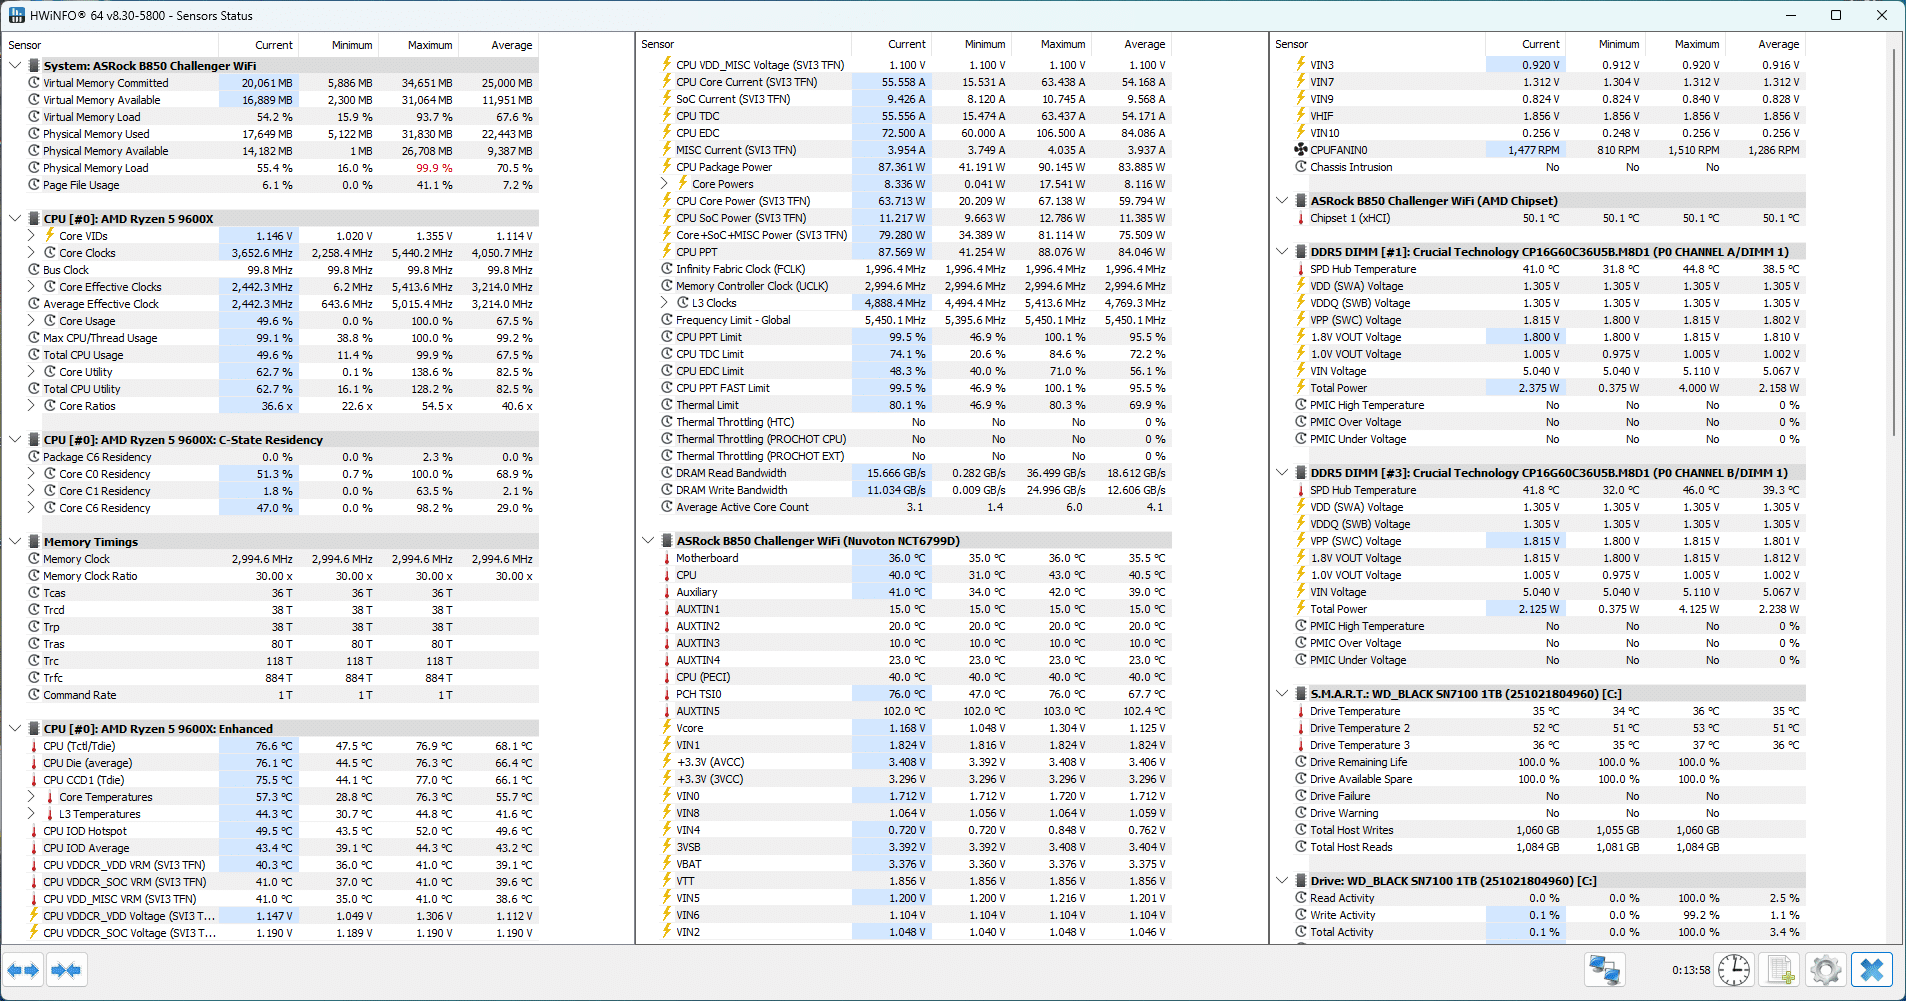
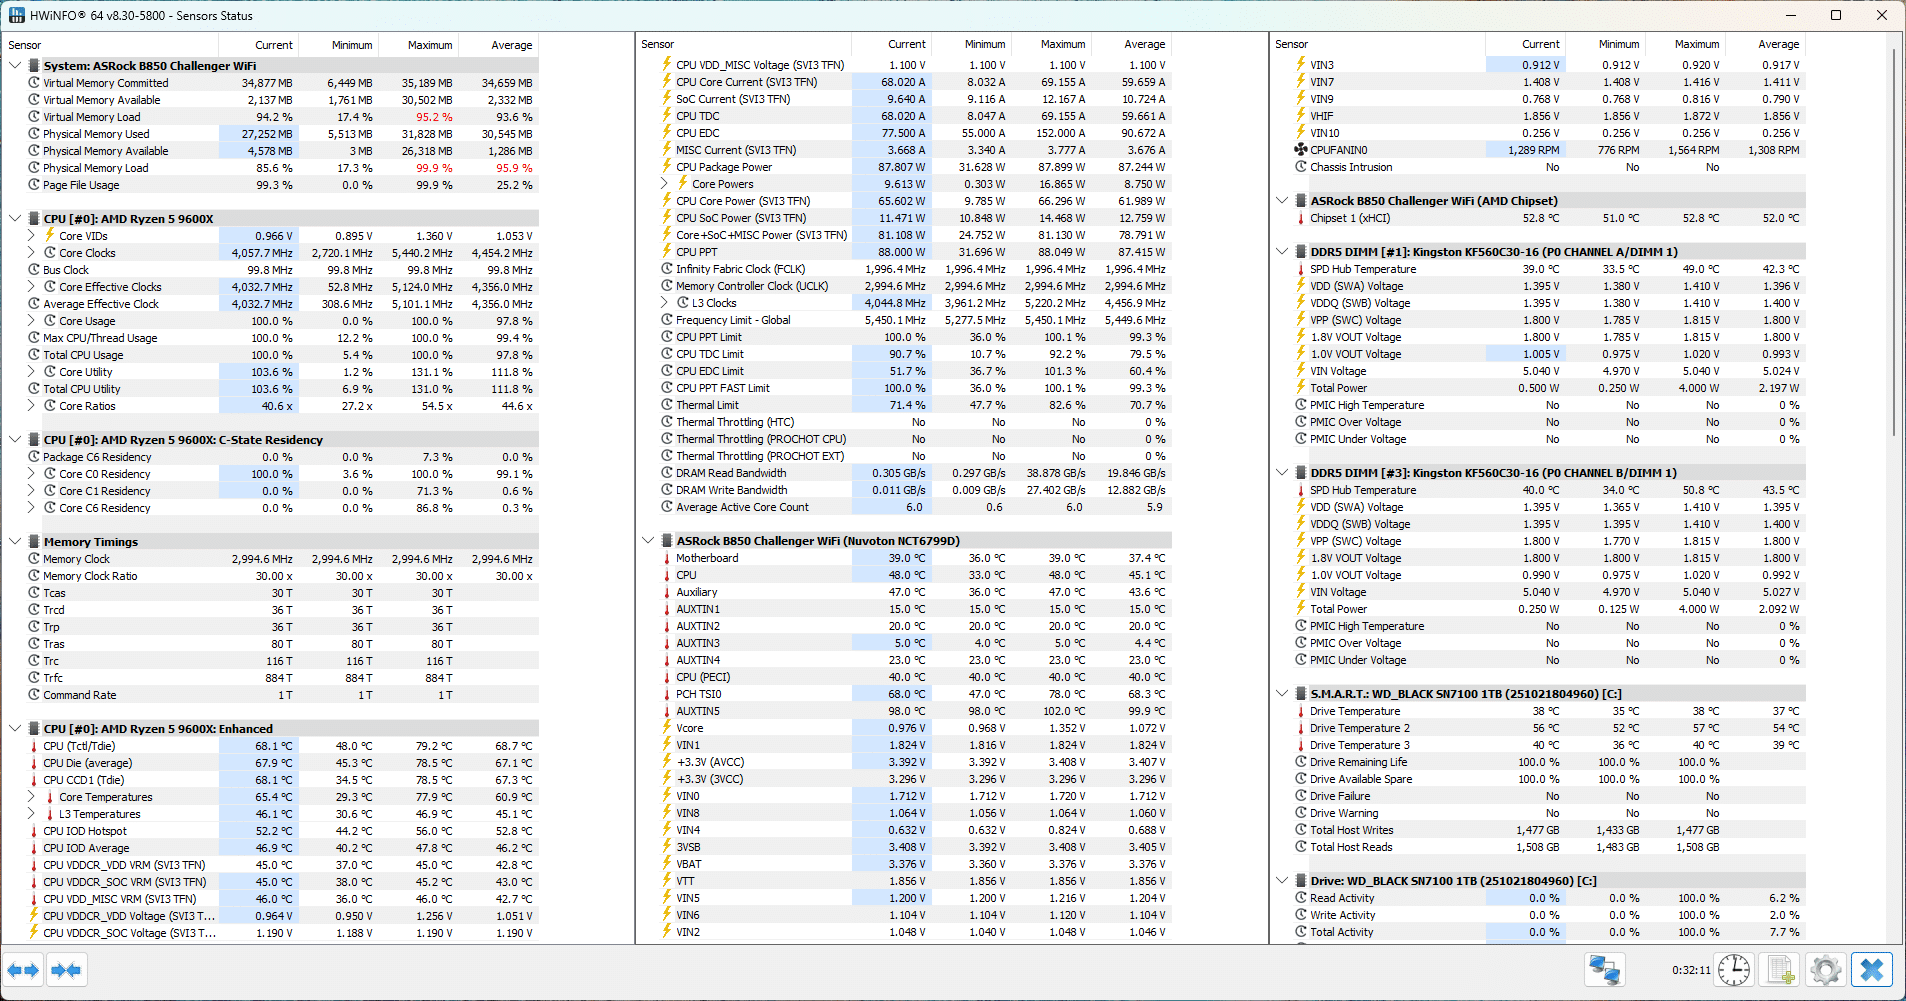
Prime95 is a tool built initially for finding prime numbers, but it has become infamous for its ability to push computers to their limits, making it perfect for endurance testing. Here, HWinfo was used to track temperatures and power consumption.
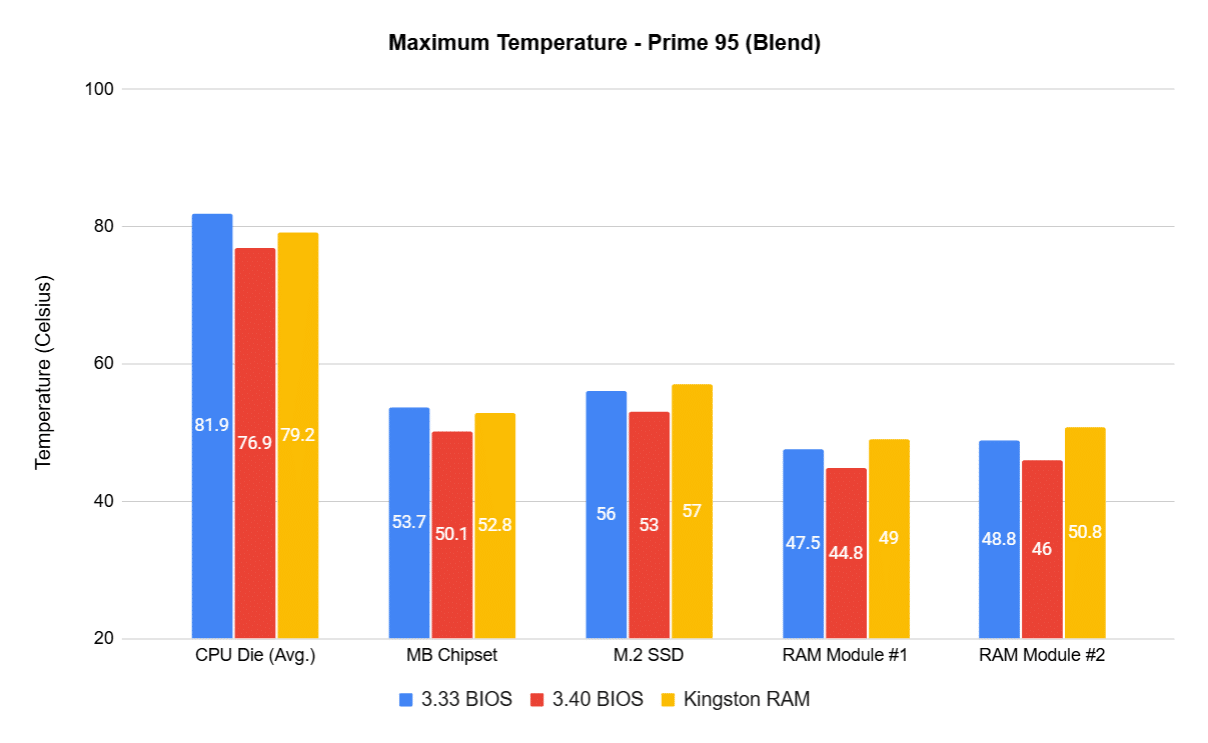
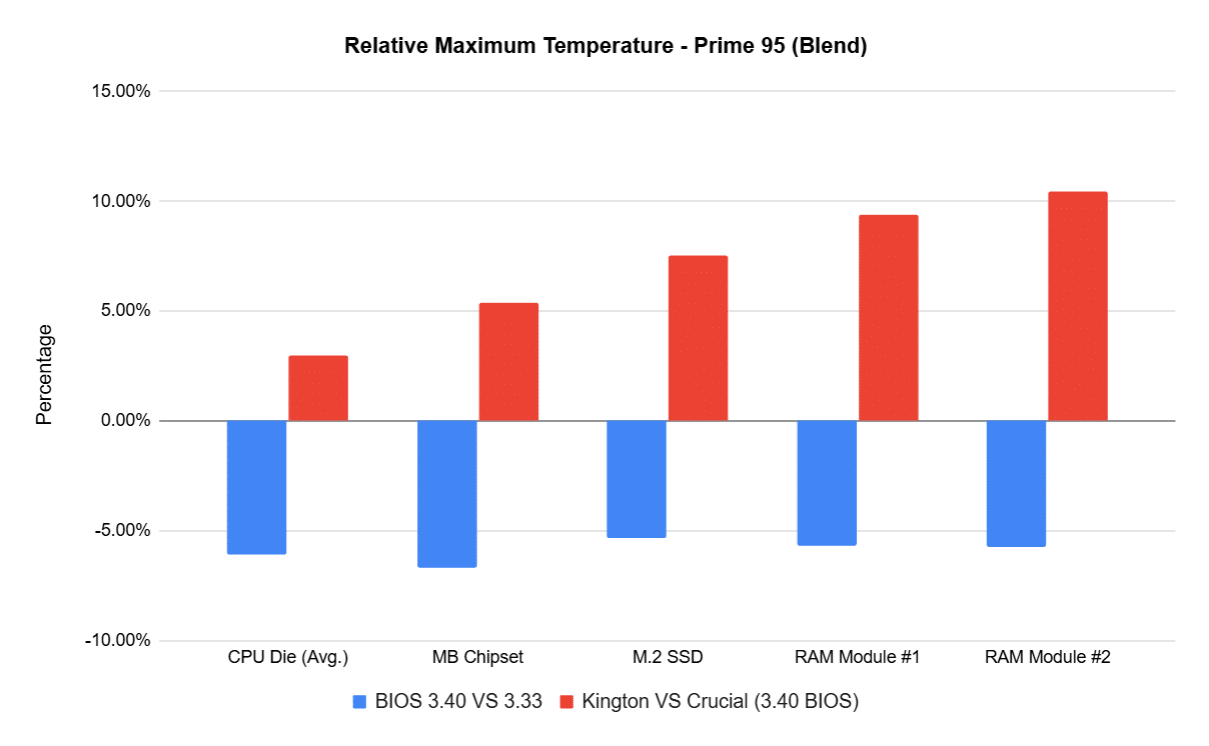
The charts show maximum temperatures on key components, followed by a relative comparison chart. Testing revealed that the system ran slightly cooler on BIOS 3.4 with the original Crucial kit, due to the difference in environmental conditions, despite being in an air-conditioned space at 27 degrees Celcious.


Blender is another test used to evaluate how the motherboard handles sustained, compute-heavy 3D rendering workloads, where VRM design and thermal handling can make a difference.
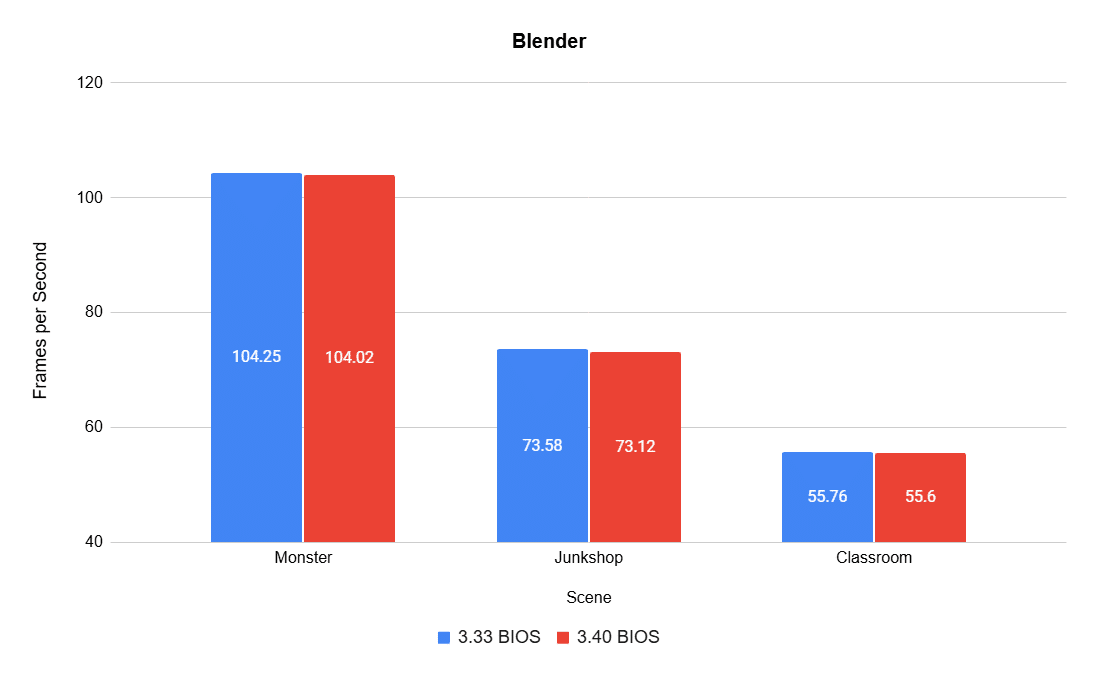
The difference between BIOS versions here was within the margin of error.
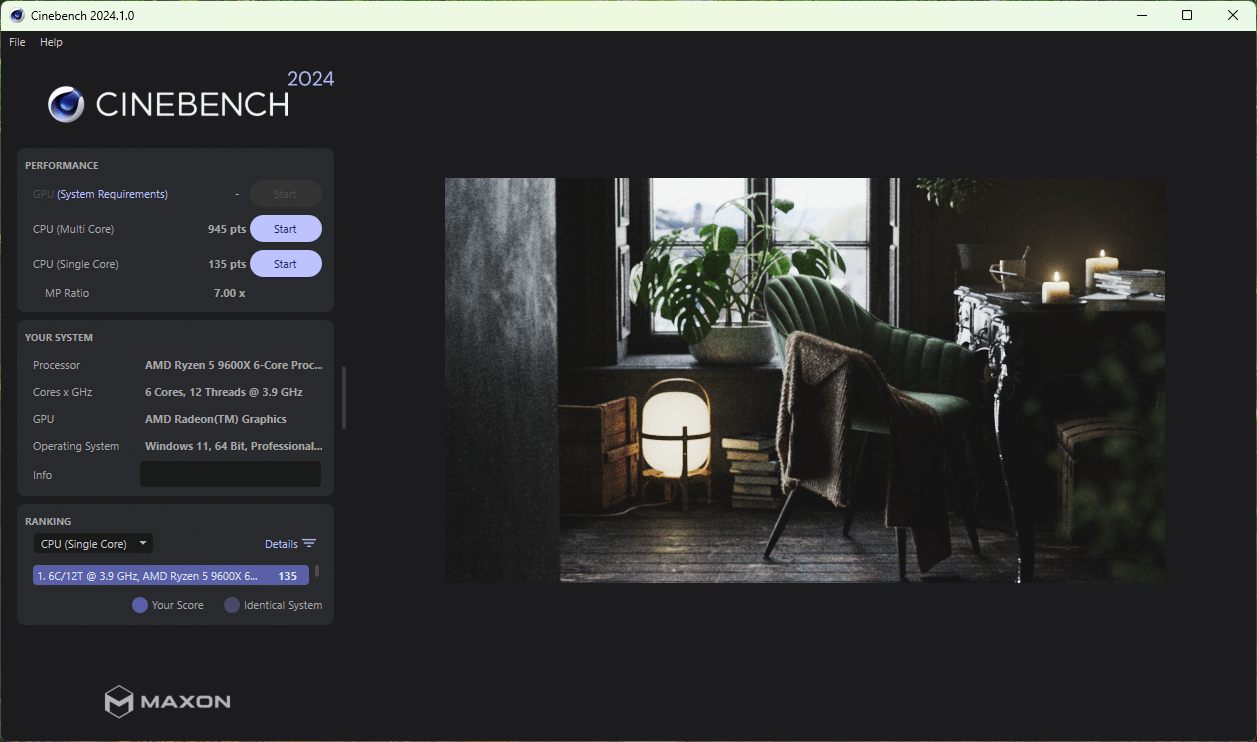
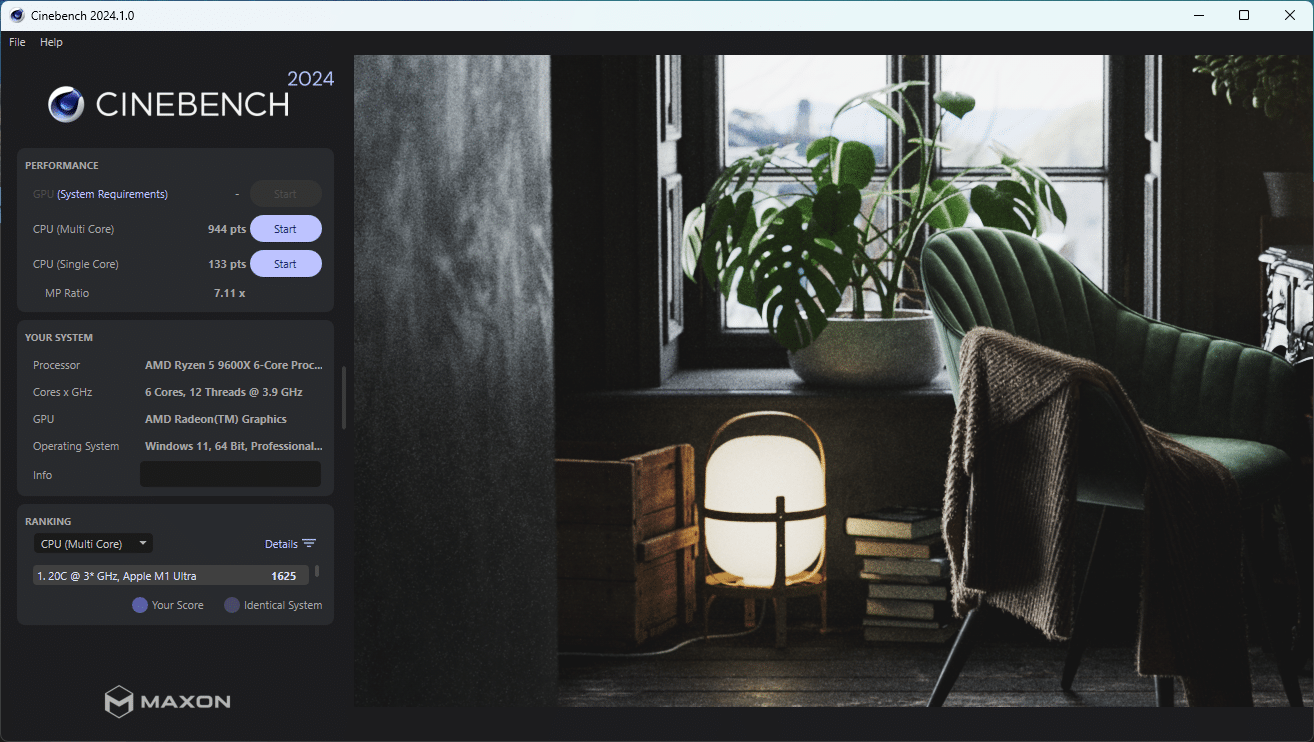
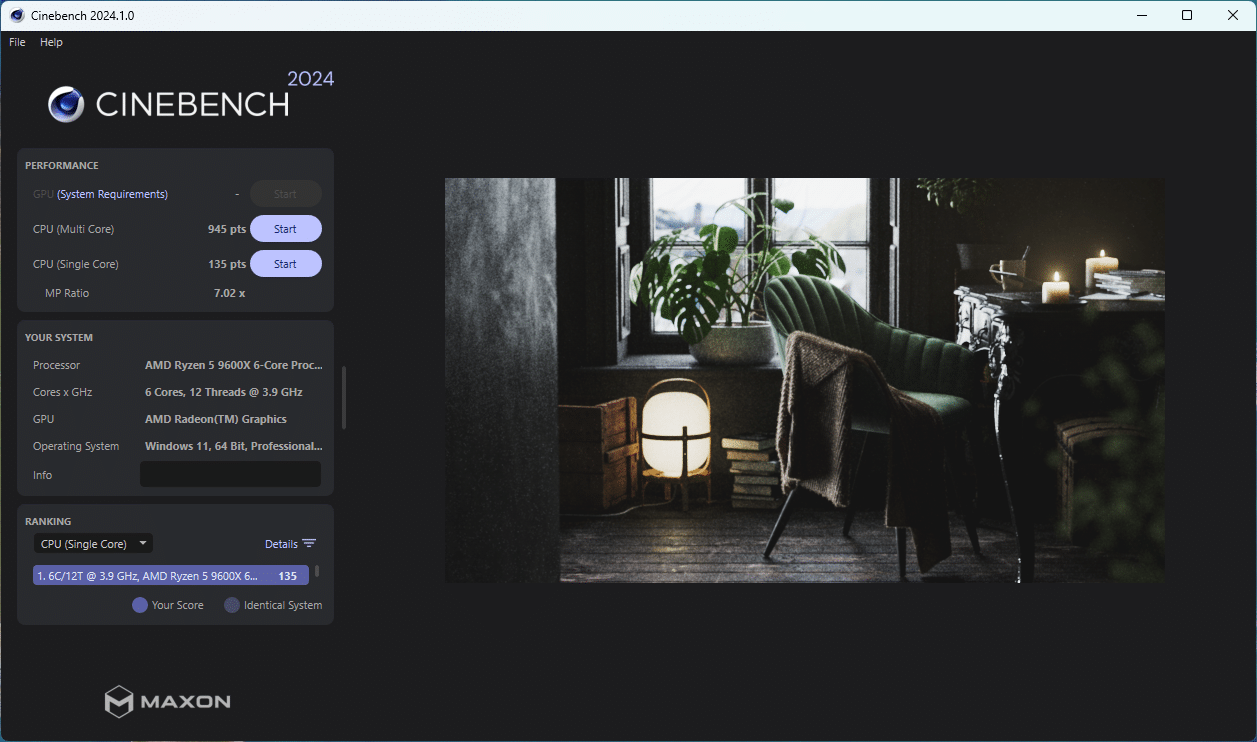
Cinebench R24, powered by the Cinema 4D engine, focuses purely on CPU horsepower.
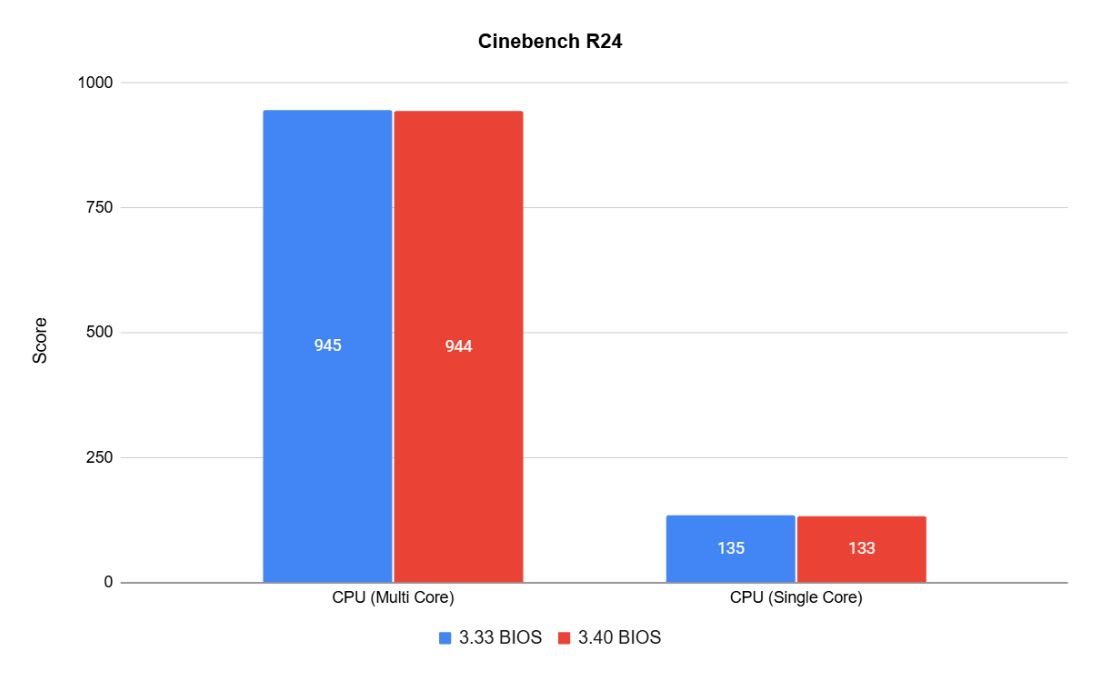
As with Blender, the differences between BIOS versions were insignificant.
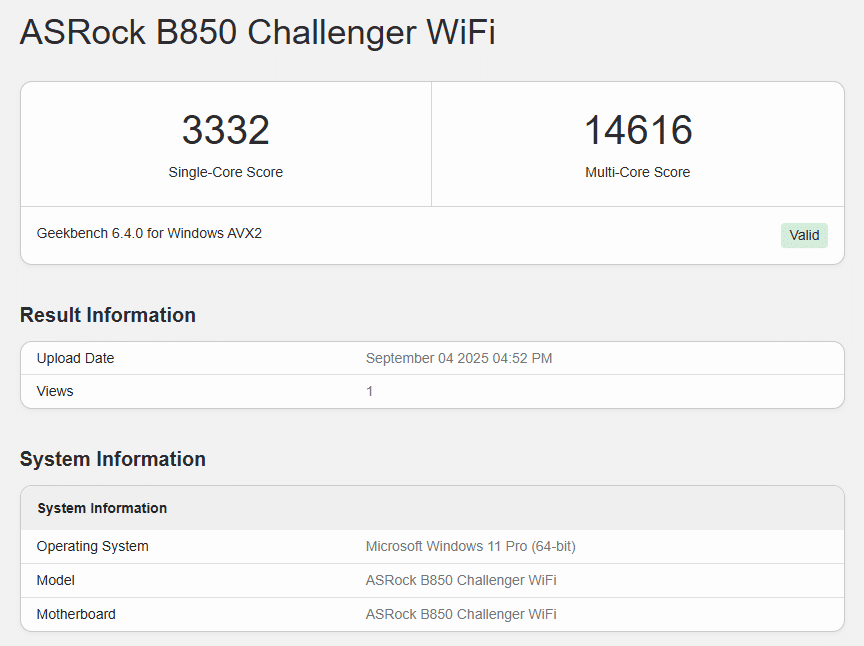
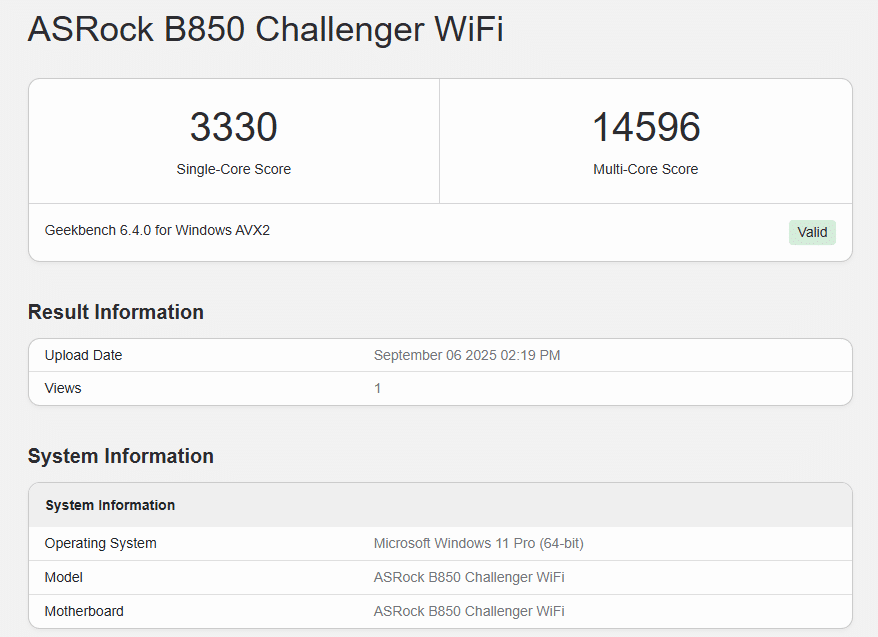
Geekbench 6 covers a wide range of mathematical and real-world tests, including image processing and machine learning. Another useful feature is the ability to compare performance across different architectures.
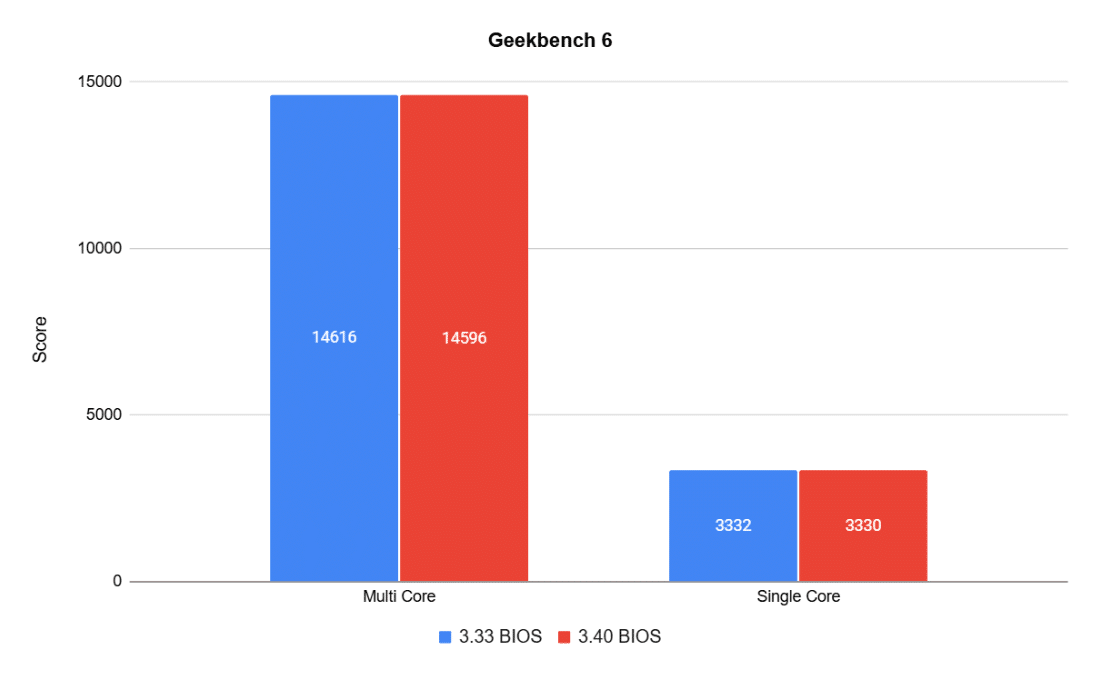
Geekbench results weren’t affected by the BIOS update either. You can access the results with the old BIOS here, and with the new one here.
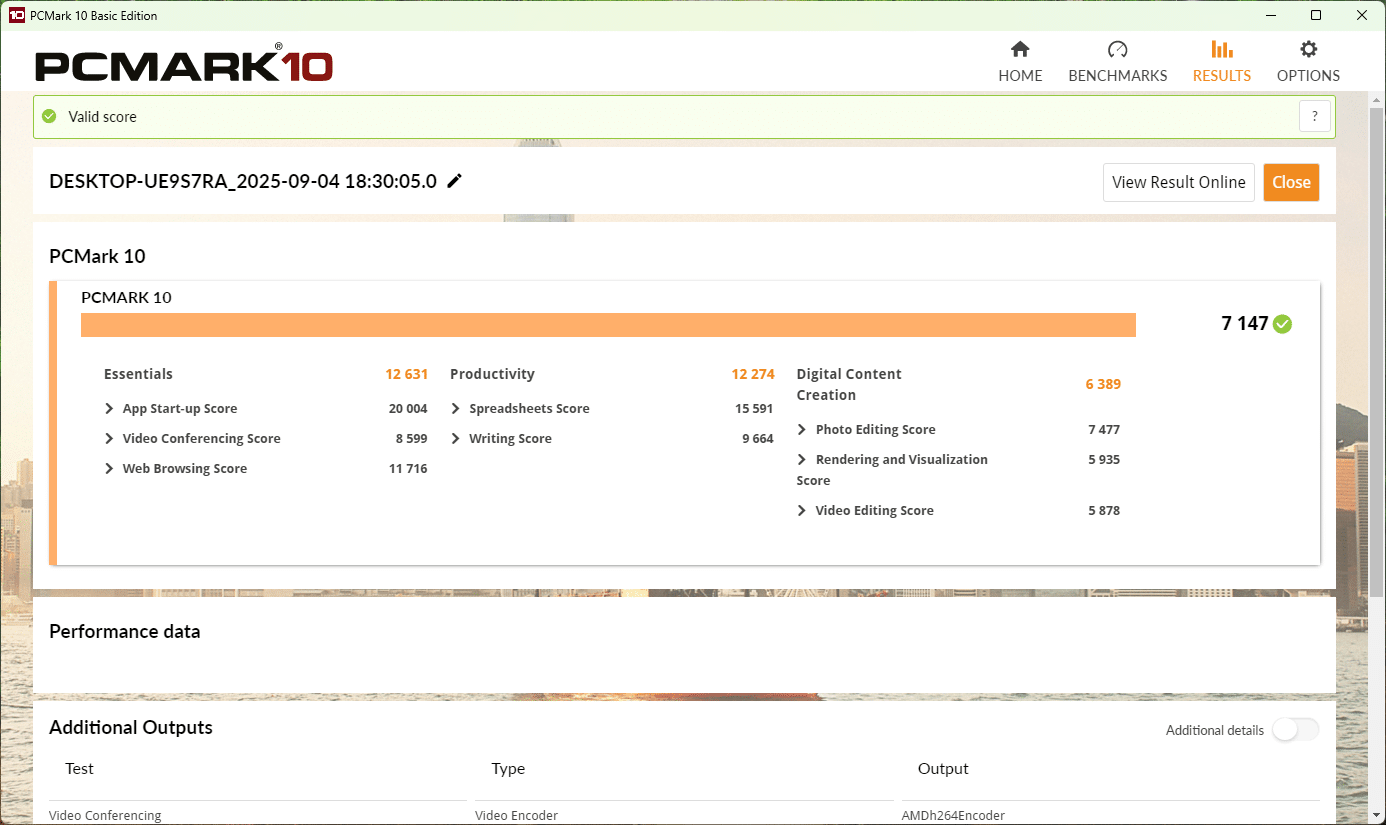
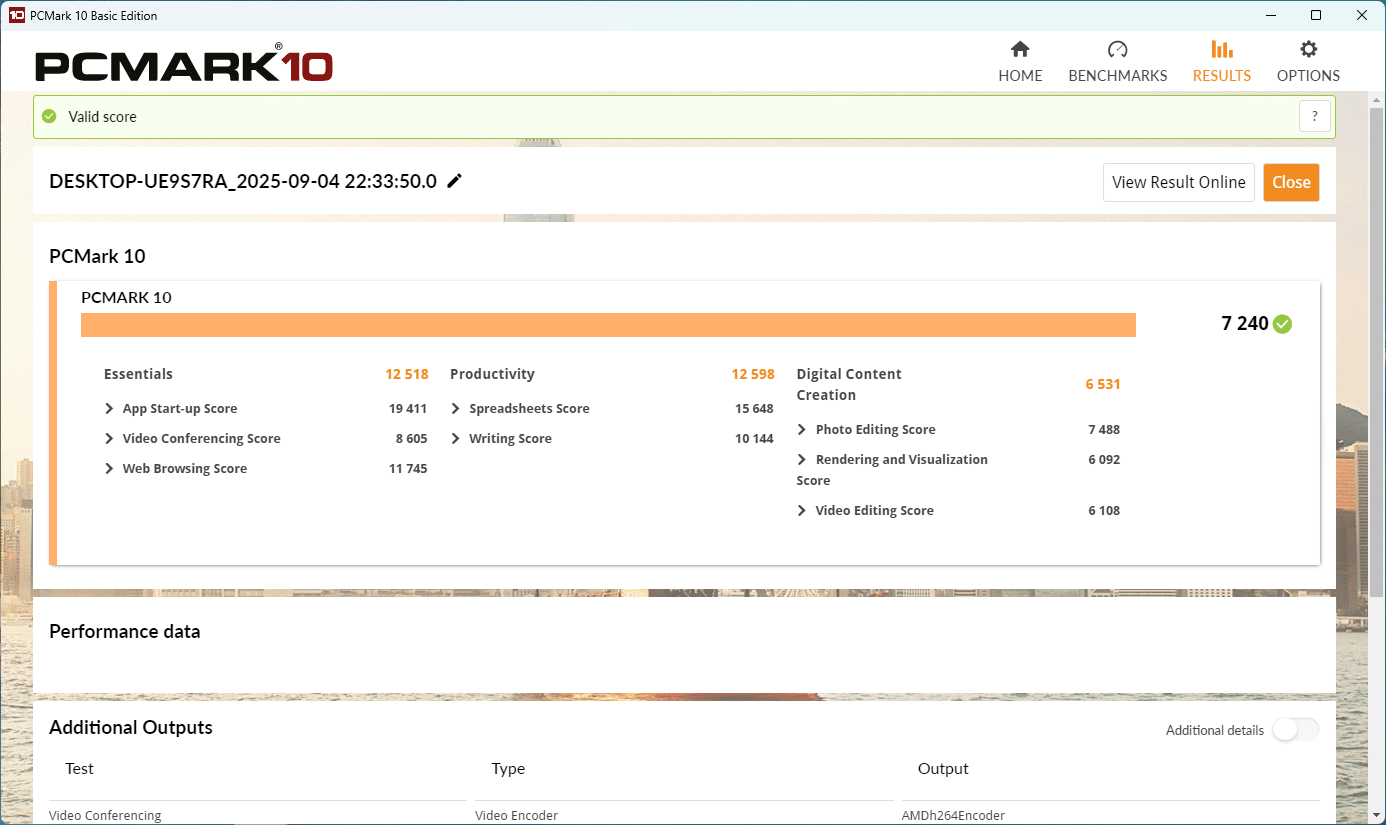
PCMark 10 runs a series of office tasks, web browsing, and creative workflows to represent some of the most common PC tasks.
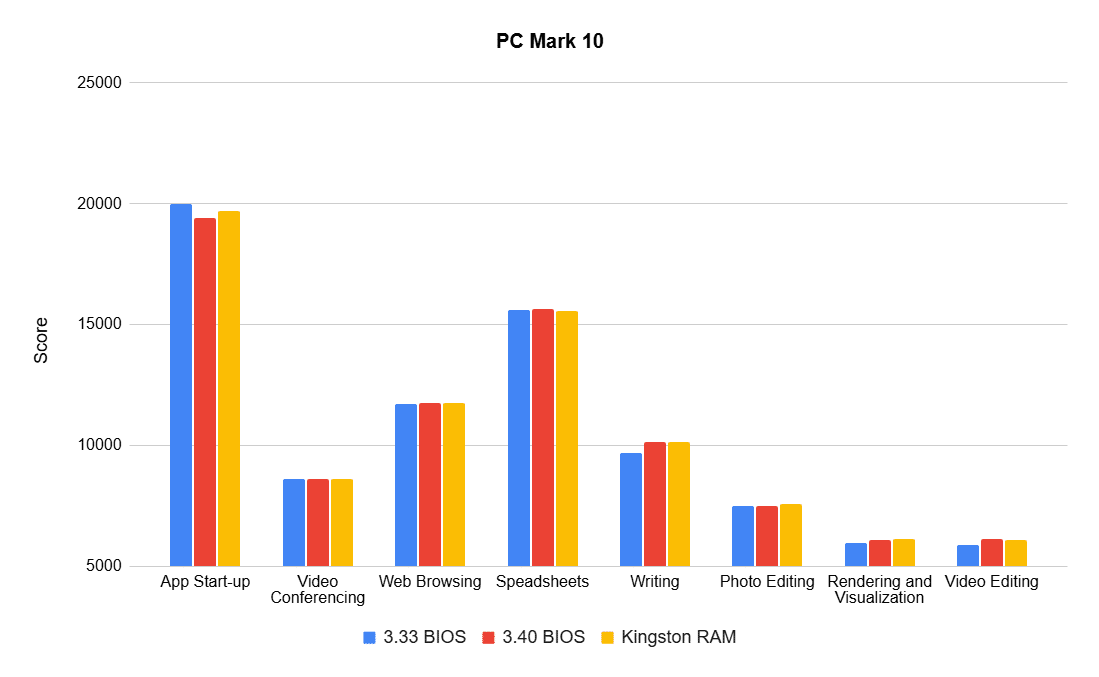
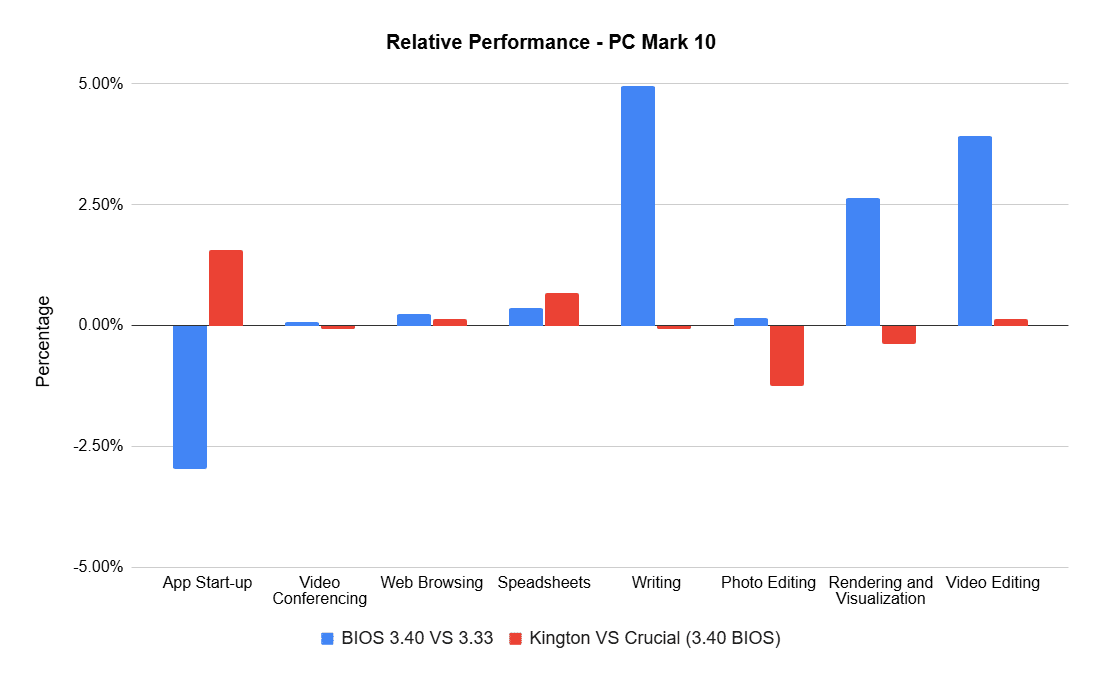
Here we begin to observe some differences between BIOS updates (blue bar in the relative performance chart). App start-up, rendering, and visualization, as well as video editing, showed minor changes. However, the writing test displayed an almost 5% performance boost with the newer BIOS. Between the two RAM kits, the differences were negligible. You can access the results with the old BIOS here, and with the new one here.
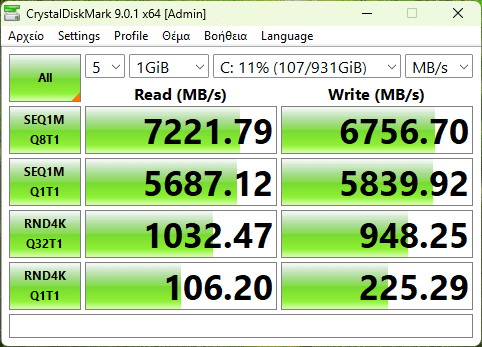
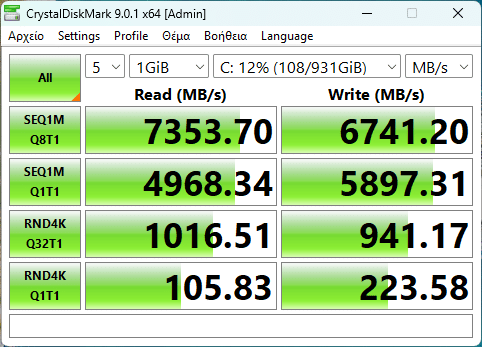
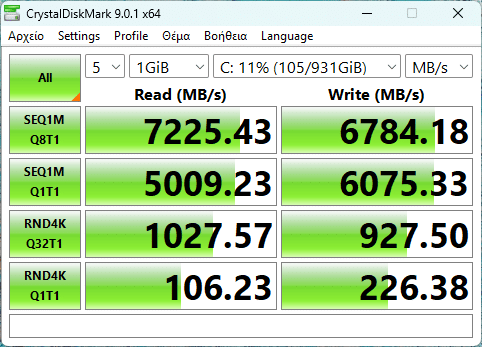
CrystalDiskMark measures storage performance, running sequential and random read/write tests to evaluate how quickly your system can move data, whether you’re loading massive files or thousands of small ones. Keep in mind, the NVMe drive we used is very fast, but not fast enough to saturate the slot.
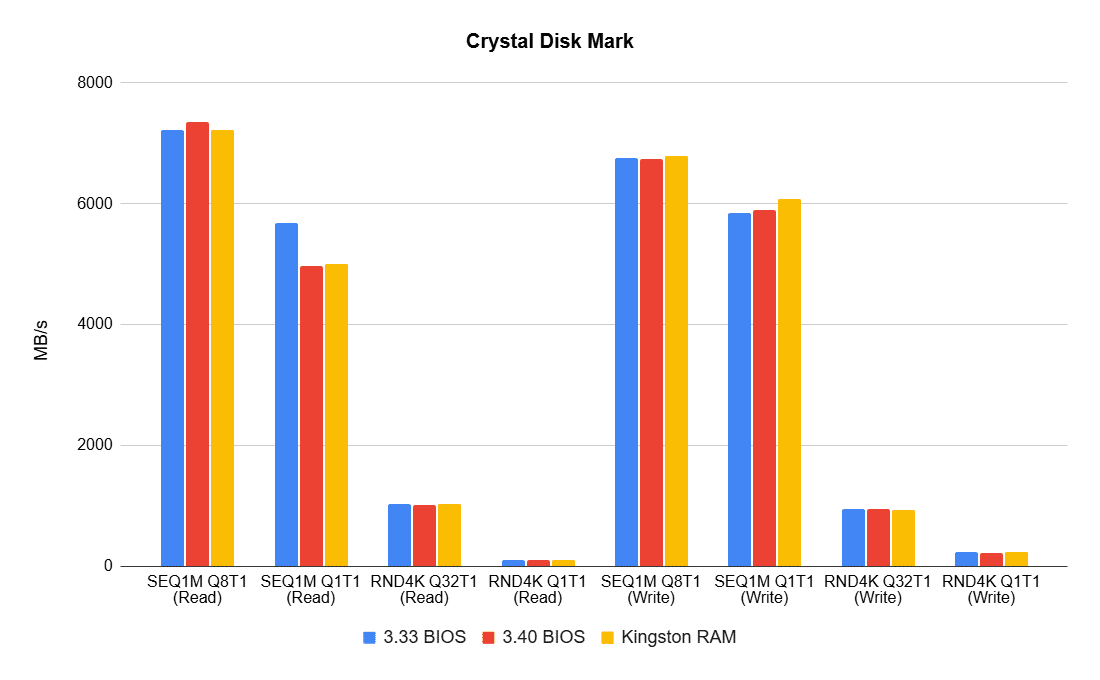
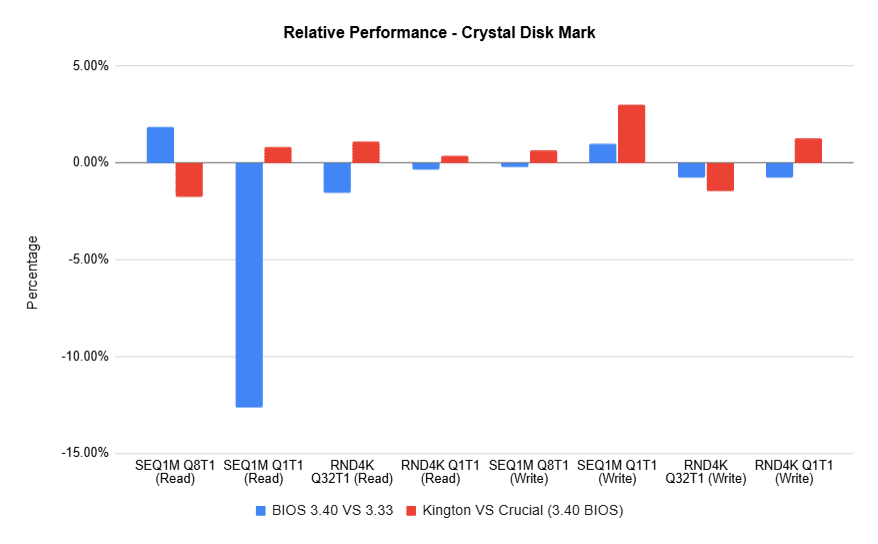
Although retesting with the Kingston kit wasn’t strictly necessary, we did so to check for variation between runs, since the SEQ1M Q1T1 test showed a significant drop under BIOS 3.4. In the end, both kits behaved virtually the same on BIOS 3.4.
| Specification | Power Consumption |
|---|---|
| Powered Off | 1.0 W |
| Idle | 44.3 W |
| Full CPU Load | 156.0 W |
Power draw was measured with Prime95’s Small FFT option, using Crucial RAM. The cooler’s ARGB was also connected and active.