Advertised Vs. Real Performance
This is probably the most crucial page, showing how accurate the data provided by the manufacturers/brands on their products is. Since nobody so far could verify these numbers, it was an open field for every brand to declare whatever it wanted, but this stops now. I should also note that I strictly follow the specific guidelines (ISO7779: 2018) for taking noise measurements in information technology and telecommunications equipment.
In the table below, anything in Red means bad news, while the Blue fonts are good!
| Performance Metric | Advertised Performance | Real Performance | Difference |
|---|---|---|---|
| Max Speed (RPM) | 1600 | 1606 | +0.38% |
| Max Input Current (A) | 0.56 | 0.27 | – |
| Max Power (W) | 6.72 | 3.28 | – |
| Qmax (CFM) | 68.1 | 72.15 | +5.95% |
| Pmax (mmAq) | 3.5 | 2.65 | -24.29% |
| Max Noise Level (dBA) | 28.5 | 32.1 | +3.6 dBA |
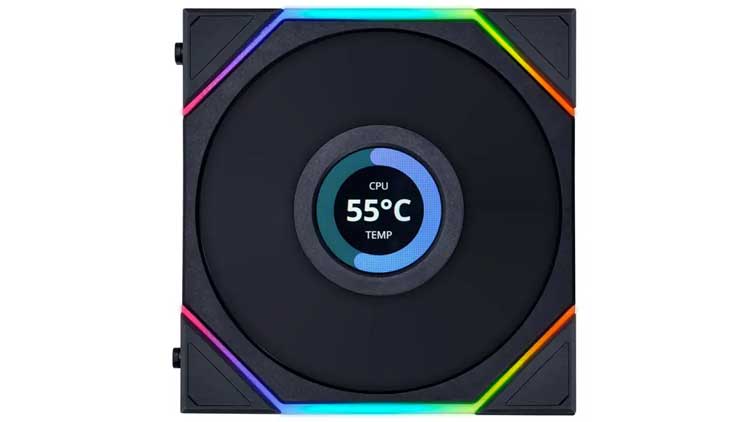
The power consumption is lower than what Lian Li states, but I had the LCD screen inactive (meaning it didn’t show anything), and the RGB lighting was off, so there is no point in evaluating the difference. Airflow is higher than the advertised, but static pressure is lower, with a significant difference. Lastly, the noise output is a bit higher than the claimed one.


Definitely DONNOT BUY THOSE FANS!
REASONS:
– L CONNECT doing nothing consumes 7% of your resources.
– each LCD screen consumes 3 to 7% of resources, especially animation or gauges. Only static images don’t consume.
– they seem to fail in under two years, when this happens replacing is a pain since they are interlocked.
When I turn all my screens to cpu gauge, it read 45% utilization just because of lian lis crappy software. 9950x, 4090, 192gb ram.
I even stopped buying their cases as a result, after 20 years of brand loyalty it evaporated due to these fans. L connect is a frankenstein as is their line of 30 incompatible unnecessarily diverse fan lines.
Amazing work! Thank you for this.
🙂
Great for when half your fans are oriented in a way where the display isn’t visible.