Advertised Vs. Real Performance
This is probably the most crucial page, showing how accurate the data provided by the manufacturers/brands on their products is. Since nobody so far could verify these numbers, it was an open field for every brand to declare whatever it wanted, but this stops now. I should also note that I strictly follow the specific guidelines (ISO7779: 2018) for taking noise measurements in information technology and telecommunications equipment.
In the table below, anything in Red means bad news, while the Blue fonts are good!
| Performance Metric | Advertised Performance | Real Performance | Difference |
|---|---|---|---|
| Max Speed (RPM) | 2050 | 2105 | +2.68% |
| Max Input Current (A) | 0.14 | 0.17 | +21.43% |
| Max Power (W) | 1.68 | 2.03 | +20.83% |
| Qmax (CFM) | 51.88 | 52.43 | +1.06% |
| Pmax (mmAq) | 2.89 | 2.17 | -24.91% |
| Max Noise Level (dBA) | 27 | 30.8 | +3.8 dBA |
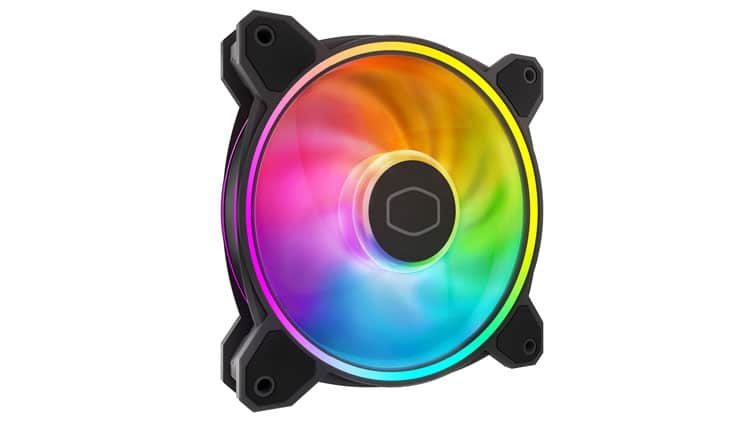
The claimed airflow is higher, not by a large margin, while the actual static pressure is notably lower than the advertised! Moreover, power consumption is much higher than what CM states.


This fan’s test data is similar to the Noctua NF-A12x25 PWM. It also has ARGB effects. Why is this fan considered low performance and expensive? It seems that brand also affects the review. haha.
Noctua NF-A12x25 PWM Fan Review – ReCheck!
https://hwbusters.com/cooling/noctua-nf-a12x25-pwm-fan-review-recheck/5/
Just wondering if the power consumption figures also include led lighting? Even without lighting consumption figures are impressive, just wondering how much additional power those leds suck.
Nope, it doesn’t include LED lighting.