Advertised Vs. Real Performance
This is probably the most crucial page, showing how accurate the data provided by the manufacturers/brands on their products is. Since nobody so far could verify these numbers, it was an open field for every brand to declare whatever it wanted, but this stops now. I should also note that I strictly follow the specific guidelines (ISO7779: 2018) for taking noise measurements in information technology and telecommunications equipment.
In the table below, anything in Red means bad news, while the Blue fonts are good!
| Performance Metric | Advertised Performance | Real Performance | Difference |
|---|---|---|---|
| Max Speed (RPM) | 1800 | 1992 | +10.67% |
| Max Input Current (A) | 0.08 | 0.1 | +25.00% |
| Max Power (W) | 0.1 | 1.25 | +25.00% |
| Qmax (CFM) | 56.3 | 52.15 | -7.37% |
| Pmax (mmAq) | 2.2 | 1.76 | -20% |
| Max Noise Level (dBA) | 10.64 | 28.6 | +17.96 dBA |
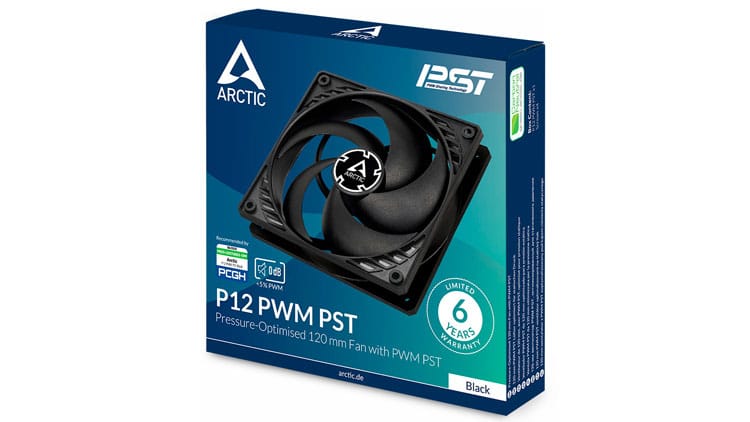
The claimed airflow and static pressure values are far away but still at very good levels, given the product’s price. In the noise output section, the brand states that this fan has a max output noise of only 0.3 Sone, which is 10.64 dBA. Nonetheless, the product’s official page, Arctic, says that the P-fans left many competitors behind in internal performance tests, leveling to 28 dB(A). When they claim only 0.3 Sone, how did they test at 28 dBA? Apparently, the 0.3 Sone rating is wrong.


this is crazy high.
I wonder why Arctic does not specify the MTTF? I found a “Life Expectancy Report” on their support page from Nov 2024 for the P9 PWM PST fan where their testing found ~210k hours MTTF at 40C: https://support.arctic.de/products/p9-pwm-pst/techdocs/MTTF%20Report,%20P9%20PWM%20PST%20(2025-01-27).pdf
I’m curious if this MTTF applies to the P12 and P14 as well?