Test Methodology
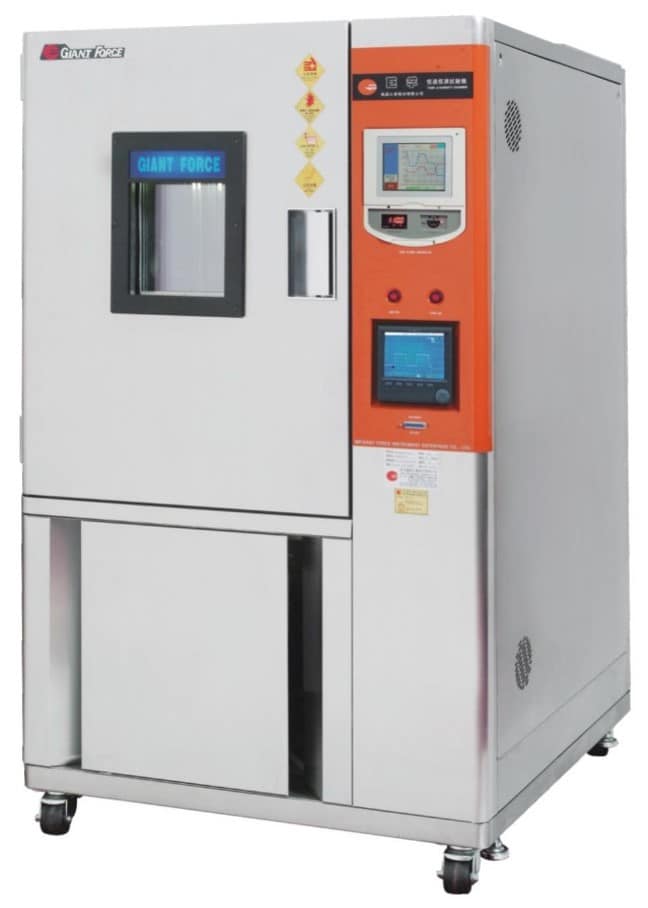
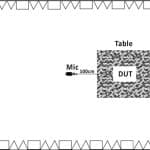
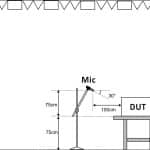
I first install the cooler into a hemi-anechoic chamber, and with the help of a highly sophisticated sound analyzer, I take all necessary noise measurements required for the testing. Afterward, I install the system inside a giant climate chamber, where the ambient temperature remains steady at 25 degrees Celsius; this way, I don’t have to take the delta difference into account since I can evaluate all coolers under the same ambient temperature. I used to believe that taking the delta difference between the measured temperature of the CPU and the ambient temperature provided accurate results. Still, after testing with the climate chamber, I soon realized this was not the case.
- Manufacturer: Giant Force
- Model Number: GTH-800-20-CP-AR
- Temp Range: -20℃ ~ +100℃
- Humidity Range: 20% ~ 98% RH
- Temp/humidity Constancy: ±0.2℃; ±2.5%RH
- Temp/humidity Uniformity at center: ±0.5℃; ±4%RH
- Indication Resolution:
- Internal Dimensions (WHD): 100 x 100 x 80 cm
- External Dimensions (WHD): 145 x 190 x 135 cm
- Net Weight (approx): 450 kgs
- Heat-up Time (No load, no linear): (from 20°C to +100°C) 30min
- Pull-down Time (No load, no linear): (from 20°C to -20°C) 50min
- Cooling System: Airtight compressor + evaporator fins + air-cooling condenser
- Power Source: 3Φ AC 380V ±5%, 50Hz±1% 10KW
- Based on Standards: ISO 5801-2007, AMCA 210-0, ASHRAE 51-2007, IEC 61591-2005, GB/T 1236-200
Besides the Giant Force climate chamber, I also use the following equipment.
- Noise Test Environment: Hemi-Anechoic Chamber with 6 dB(A) noise floor
- Conditions: 25 (+-2) degrees Celsius, 40-50% humidity
- Sound Analyzer: Bruel & Kjaer 2270-S G4
- Microphone: Bruel & Kjaer Type 4955-A
- Mic Calibrator: Bruel & Kjaer Type 4231
- Data Logger: Picoscope TC-08
To evaluate the coolers, I use a super power-hungry Intel i9-13900K. This beast reaches 360W of sustained load, which I measure accurately using a Powenetics v2 system. Below are all the parts of the CPU cooling station test system. The thermal paste I use is the Arctic Cooling MX-4. I run at least two test sessions and take the average results.
| Intel Test System Specs | ||||
| Mainboard | Asus Prime Z690-A | |||
| CPU | Intel 13900K Package Power Limit (PL1, PL2) set to 250W | |||
| GPU | NVIDIA 1070 Ti | |||
| NVMe | XPG GAMMIX S50 Lite 1TB | |||
| RAM | XPG Lancer DDR5 (2 x 16GB) 6000MHz | |||
| Power Supply | Seasonic Vertex 1200W (Cybenetics Platinum) |
|||
| CPU Cooler | What is under test! | |||
| Case | DimasTech Bench | |||
| Ambient Temperature | 25°C ±0.5°C | |||
| Humidity | 30% ±4%RH | |||
I also use an AMD system to evaluate the cooler’s performance.
| AMD Test System Specs | ||||
| Mainboard | Asus TUF GAMING X670E-PLUS | |||
| CPU | AMD Ryzen 9 7900x | |||
| GPU | Embedded | |||
| NVMe | XPG GAMMIX S50 Lite 1TB | |||
| RAM | XPG Lancer DDR5 (2 x 16GB) 6000MHz | |||
| Power Supply | Seasonic Vertex 1200W (Cybenetics Platinum) |
|||
| CPU Cooler | What is under test! | |||
| Case | Cooler Master Test Bench | |||
| Ambient Temperature | 25°C ±0.5°C | |||
| Humidity | 30% ±4%RH | |||
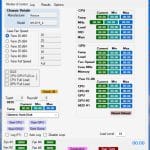
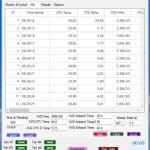
The load application is no other but the notorious Prime95 (small FFTs), which applies a tremendous load to the processor. I run each test for 20 minutes, allowing for a 10-minute cool period between each test. The whole procedure is fully automated thanks to a particular application that I made for this purpose. In AIOs, the pump runs at full speed during the entire testing duration.
The critical point in my methodology for coolers is that I consider the CPU’s average frequency during testing because it doesn’t remain steady throughout the tests. It constantly changes according to the load and the operating temperatures. Moreover, I have the Powenetics system to continually measure the CPU’s power consumption, which is way more accurate and faster than using a software solution like HWinfo.
I really believe that Aris did not get my remark. lol
He die not said what is correct,so he is not wrong.Ahah
I guess he did not realize that in ALL reviews’ charts of “CPU Wattage” category, there is the wording “Avarage Power Consumption – *Lower* is Better”, INSTEAD OF “Avarage Power Consumption – *Higher* is Better”. It is just kind of a typo or whatever. I hope it is fixed. Howsoever, this review is outstanding!
yes indeed it was a typo. Changing all graphs now is huge work, so please bear with it 🙂
Hi, great review as always.
I see on Amazon France the 280 normal at 71€ and 83€ for the rgb.
If you could add on the backlog the newest Thermaltake TOUGHFAN EX12 Pro, i ordered the 3 pack version. Hope it performs as well as the 12 Pro.
Thanks <3 (we need more cat pictures)
“Lower is better” in “Average Watt” chart: why? would not the correct word be “HIGHER is better”?
When the CPU gets more Watts, it means that its cooling is more effective, so for this purpose higher is better.
So the information in the chart title is wrong, right?
it is correct.
I’m confused.
The charts say “lower is better”. Why?