Thermal Performance – Noise Normalized 25 dBA
This is the fifth chassis review I have made following the new methodology for thermal evaluation, so you will find only five entries in the charts below. Soon enough, there will be plenty of them!
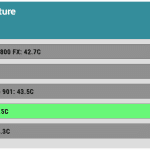
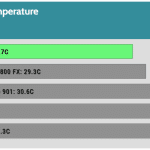
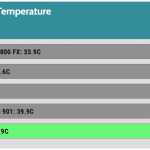
IDLE Thermal Results
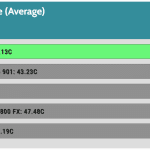
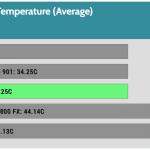
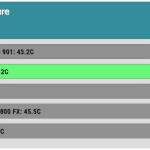
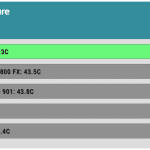
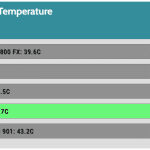
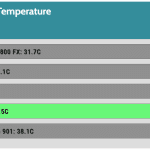
The IDLE temperatures align with the other chassis I have evaluated so far.
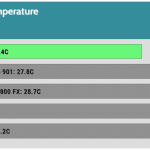
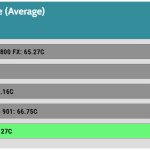
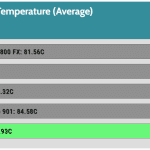
Torture (Prime95 + Furmark) Thermal Results
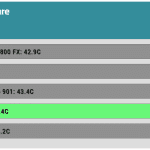
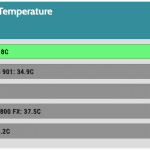
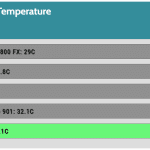
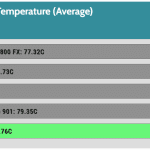
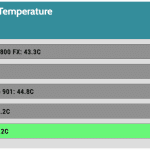
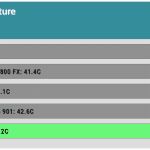
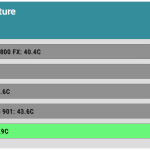
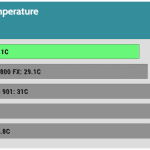
CPU and GPU temperatures are slightly higher than those of the other chassis. In general, thermal differences are low so far, making me wonder whether running the corresponding tests is worth the trouble.
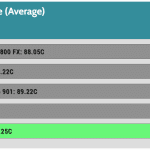
Gaming Results
CPU & GPU Average Clock Frequencies
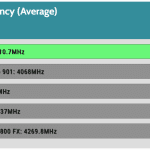
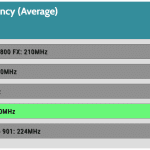
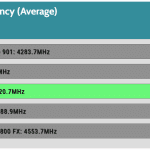
We have to look at the average CPU and GPU clocks to get a complete picture since higher clocks mean more thermal load, which pushes the cooling system more. If we have two cooling systems with only a 1-2 degrees Celsius difference and a 100-200 MHz difference in the clock speeds of the CPU or the GPU, it is easy to find the best performer.
These are the most interesting graphs because they show how the different chassis affect the CPU and GPU clocks. The most notable differences are in CPU frequencies.

