Benchmark Results
For this round, we put our test bench through a curated lineup of benchmarks that touch everything from raw storage speed to sustained CPU torture.
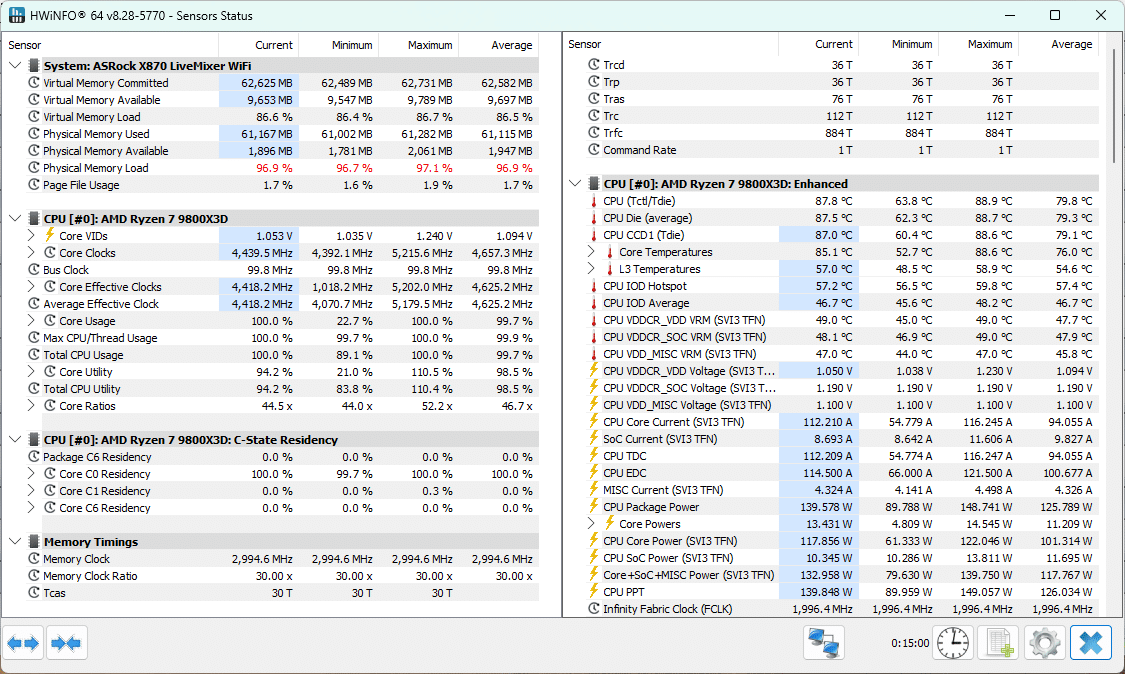
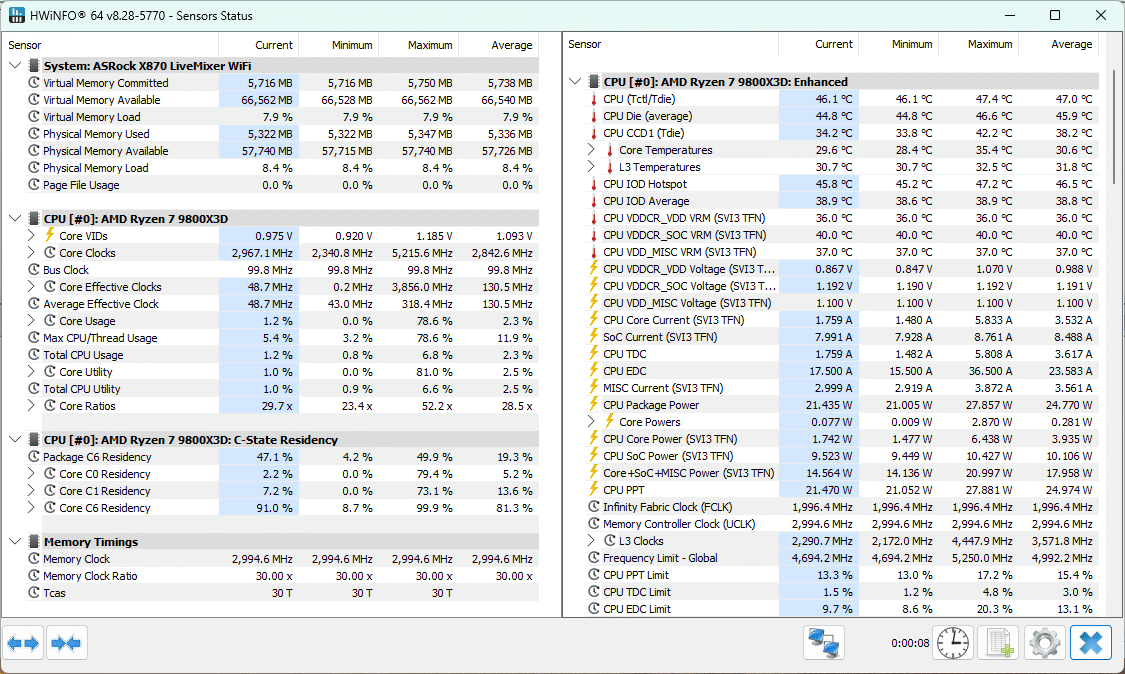
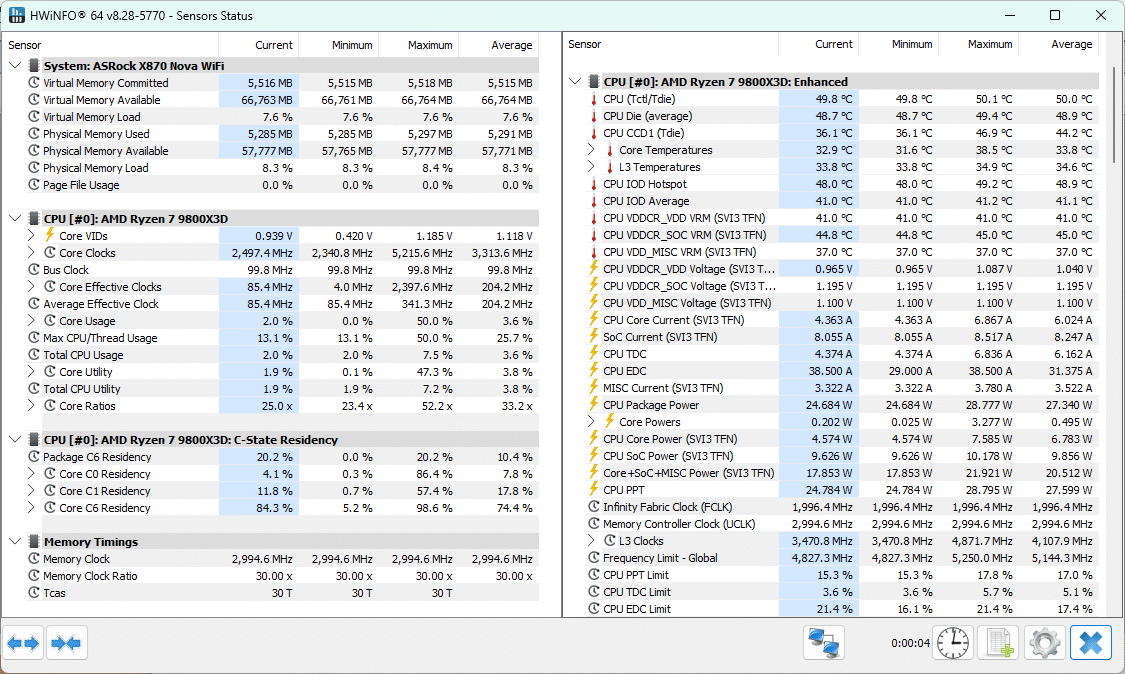
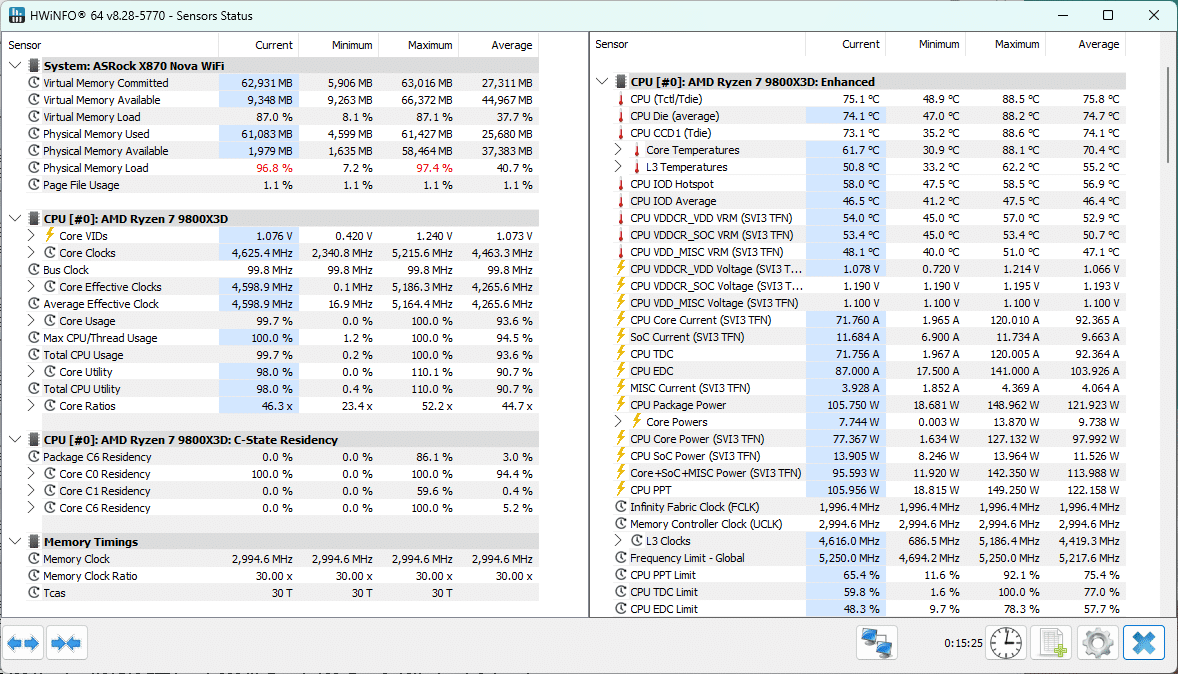
Prime95 is the sledgehammer in the toolbox. Initially built for finding prime numbers, it’s become infamous for its ability to push CPUs to their thermal and stability limits. Running it for extended periods is less about score and more about endurance. Both boards ran for fifteen minutes each using the Blend setting, with HWinfo monitoring temperature and power.
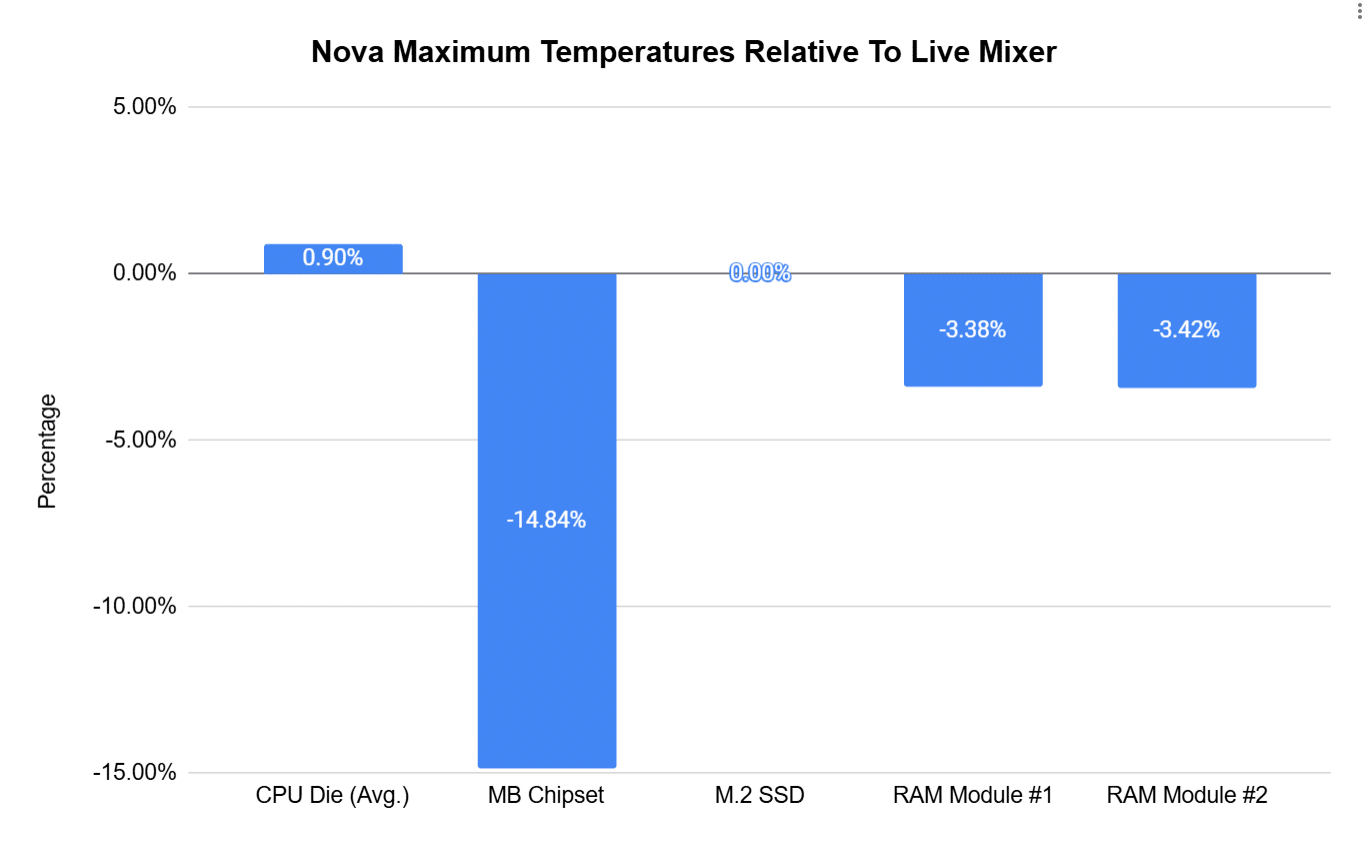
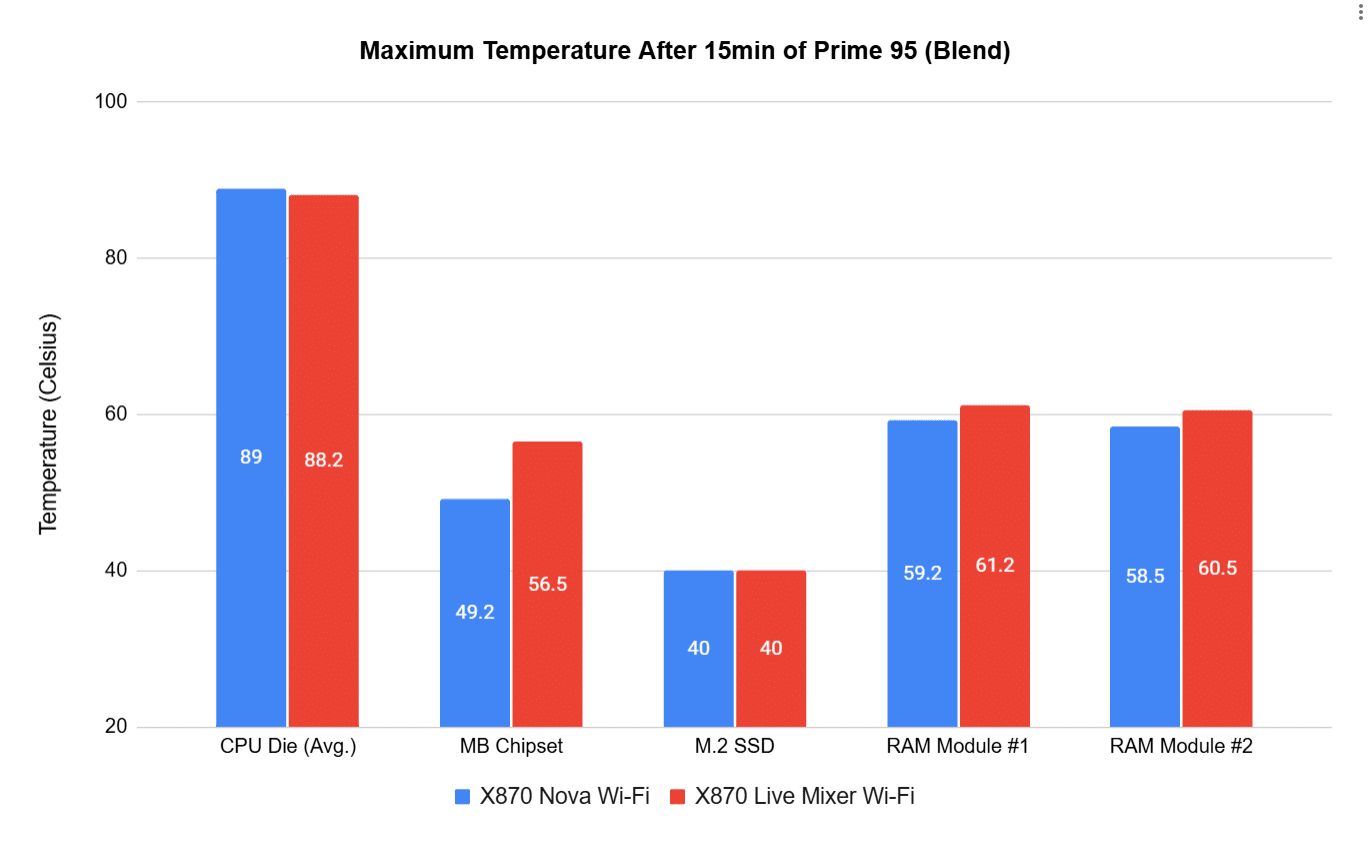
Results were within the margin of error for the CPU die. The M.2 SSD had the same temperature. Still, the RAM modules ran slightly cooler on the Nova, and the motherboard’s chipset ran significantly cooler on the Nova due to differences in the cooling solution.
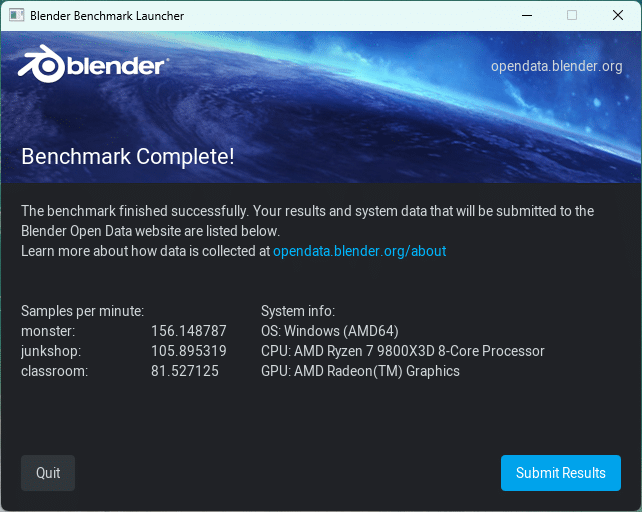
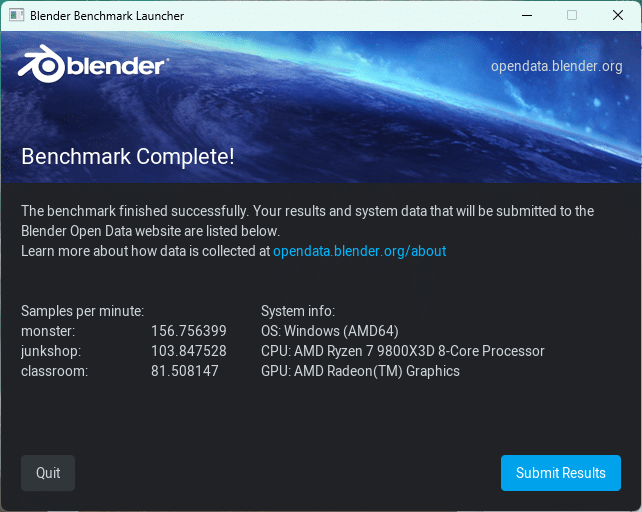
Blender puts the CPU and memory subsystem through a 3D rendering workout. It’s a practical way to see how the motherboard handles sustained, compute-heavy loads, where VRM design and thermal handling can make a real difference. The results in this case were within a margin of error from each other.
HandBrake is the go-to for video encoding tests. This popular, open-source transcoder stresses both CPU cores and instruction set optimizations, revealing how a motherboard’s power delivery and cooling influence sustained throughput. For video transcoding, both completed the task of downscaling the “Tears of Steel” short movie from 4K to 1080p in exactly two minutes, using H.264 encoding in an MP4 container, and no filters. The file used can be downloaded from the official webpage.
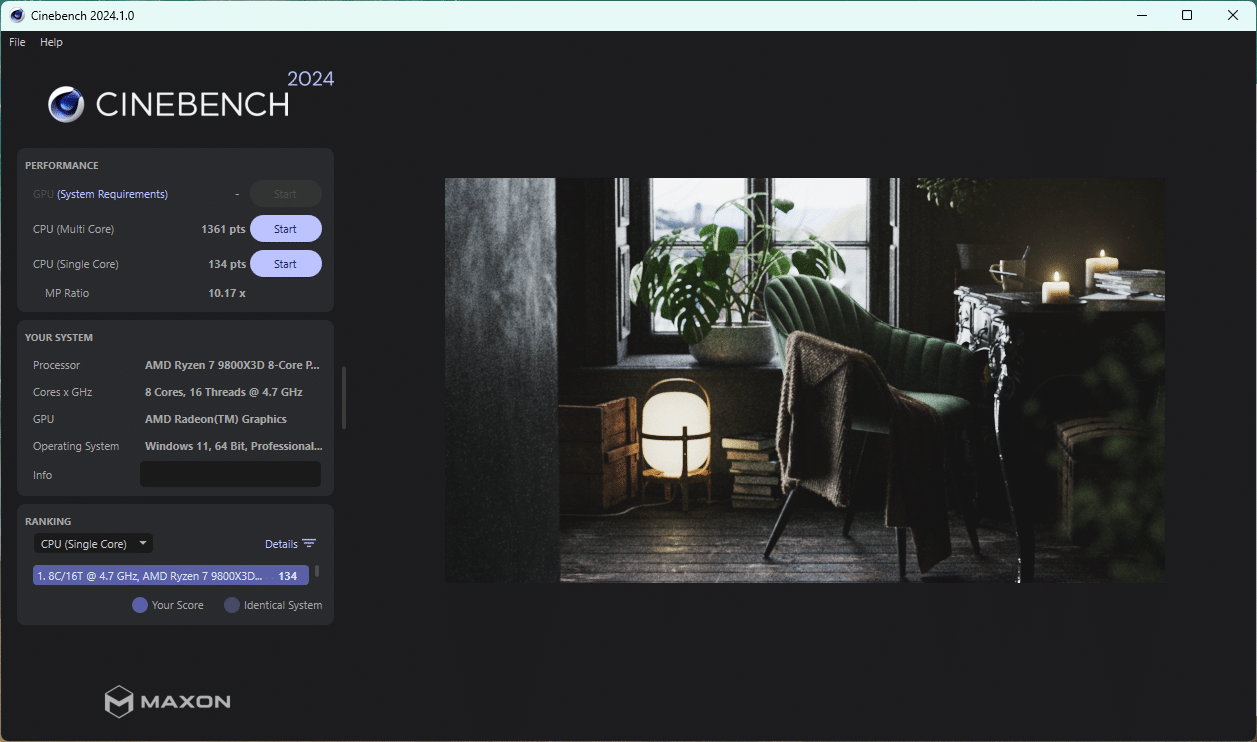

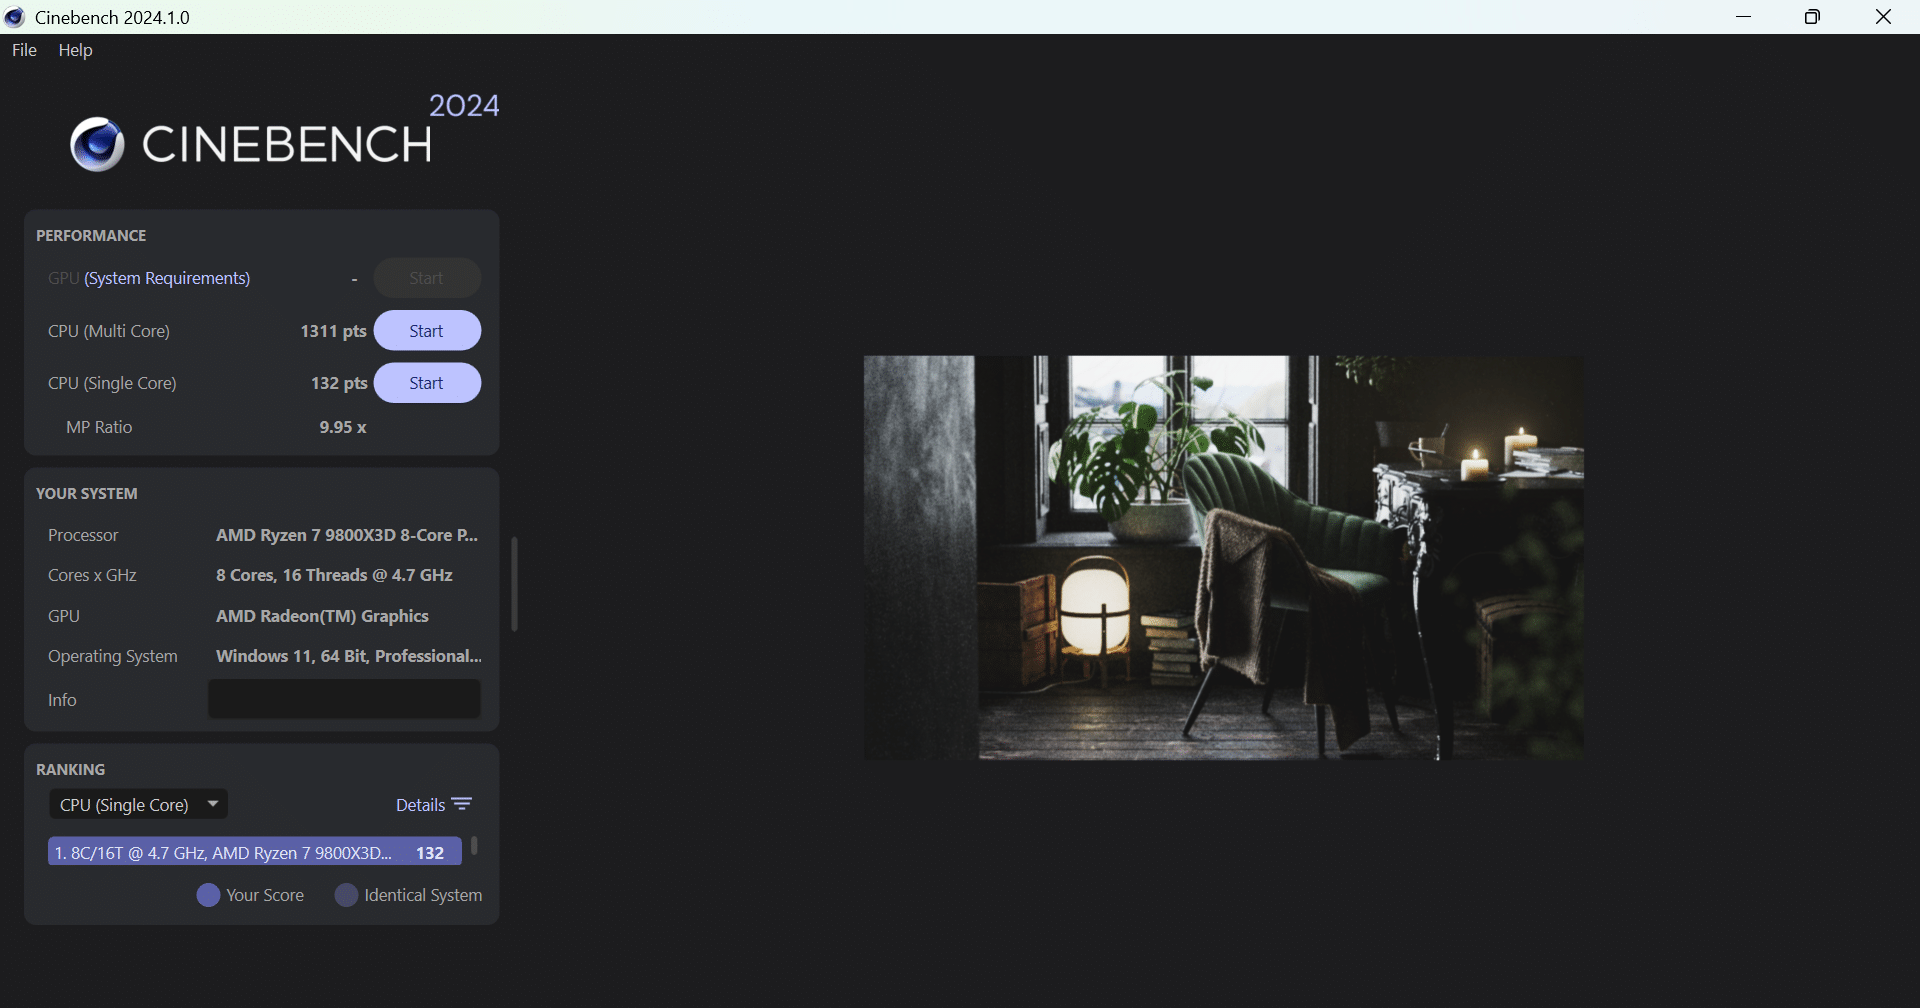
Cinebench R24 continues the rendering theme but leans into pure CPU horsepower, using the Cinema 4D engine to measure both single-thread and multi-thread performance. It’s a clean snapshot of raw computational speed, free from storage or GPU bottlenecks. Both boards are within the margin of error from each other. To showcase the effect of EXPO, take a look at the last screenshot, which shows the performance without it.
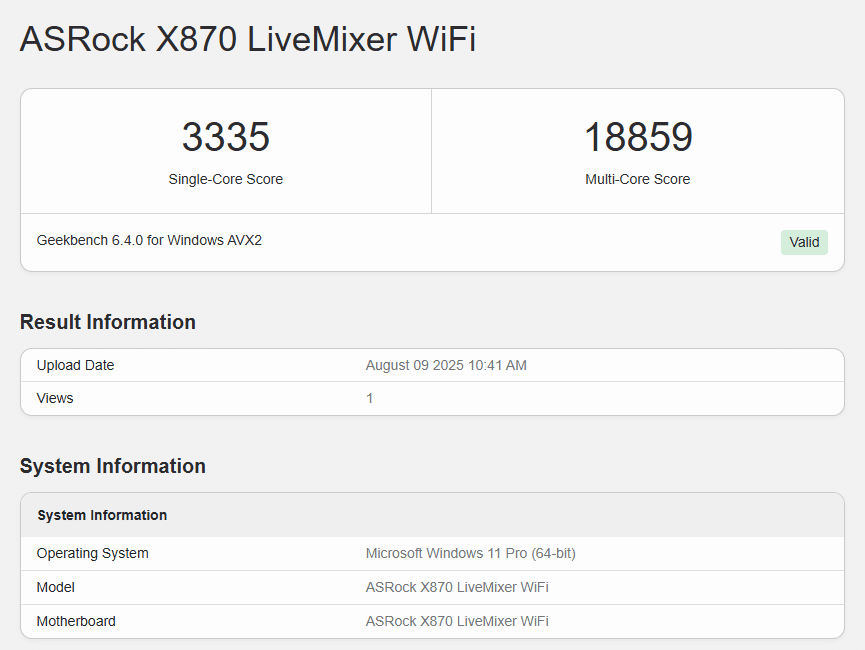
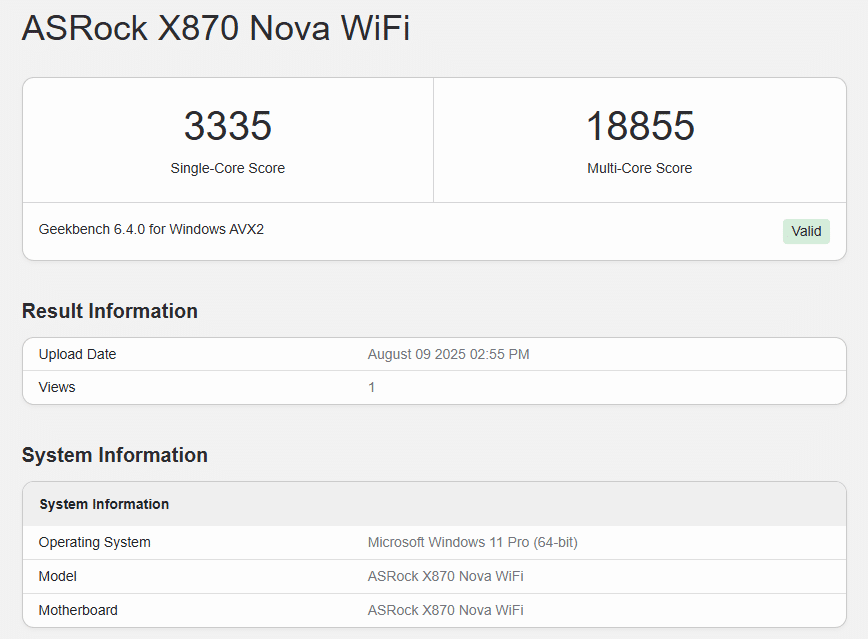
Geekbench 6 broadens the scope, running cross-platform tests that cover integer math, floating-point performance, and real-world scenarios like image processing and machine learning. It’s fast, consistent, and helpful in comparing results across different architectures. In CPU testing, single-core performance was identical, and multi-core performance was virtually identical. You can access the Live Mixer results here, and the Nova results here.
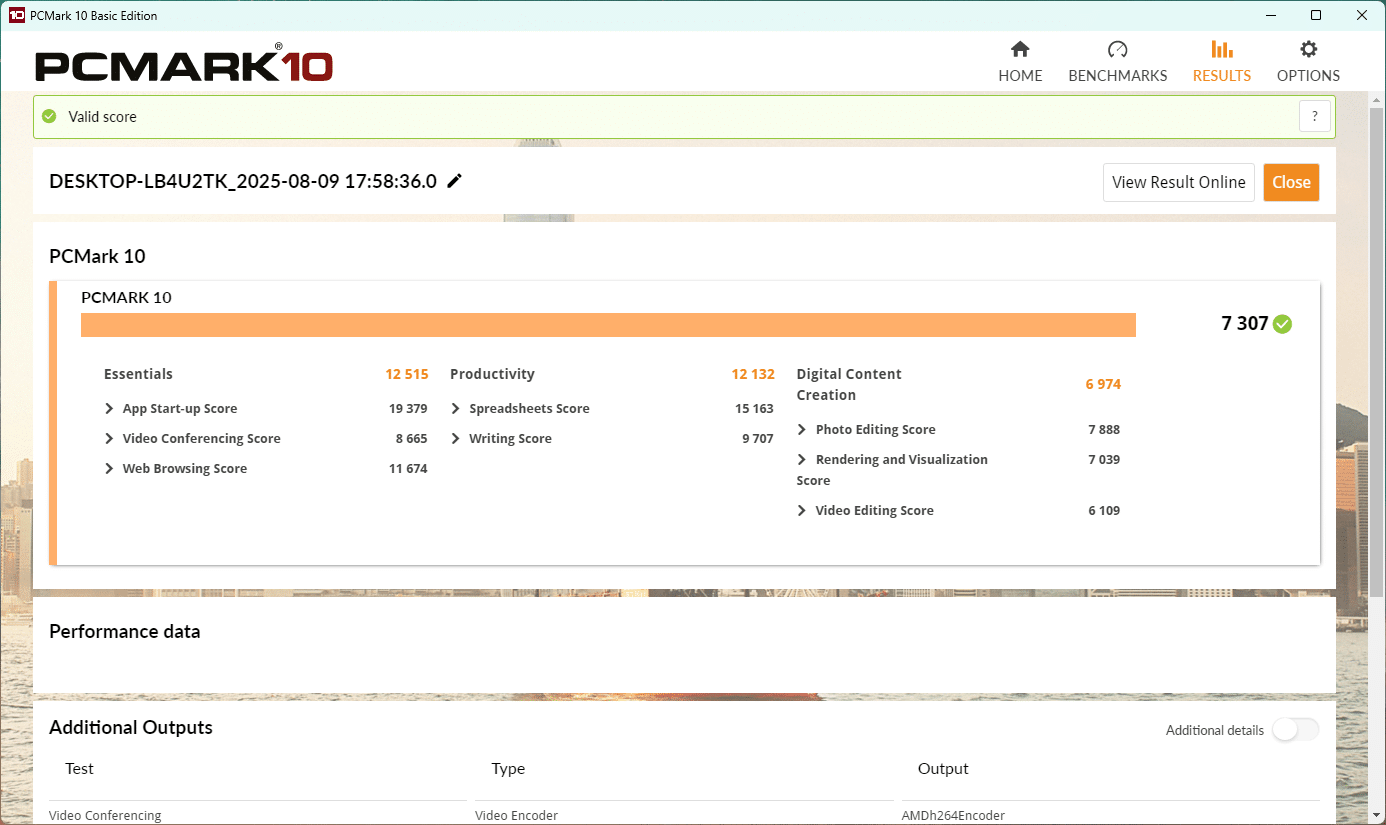
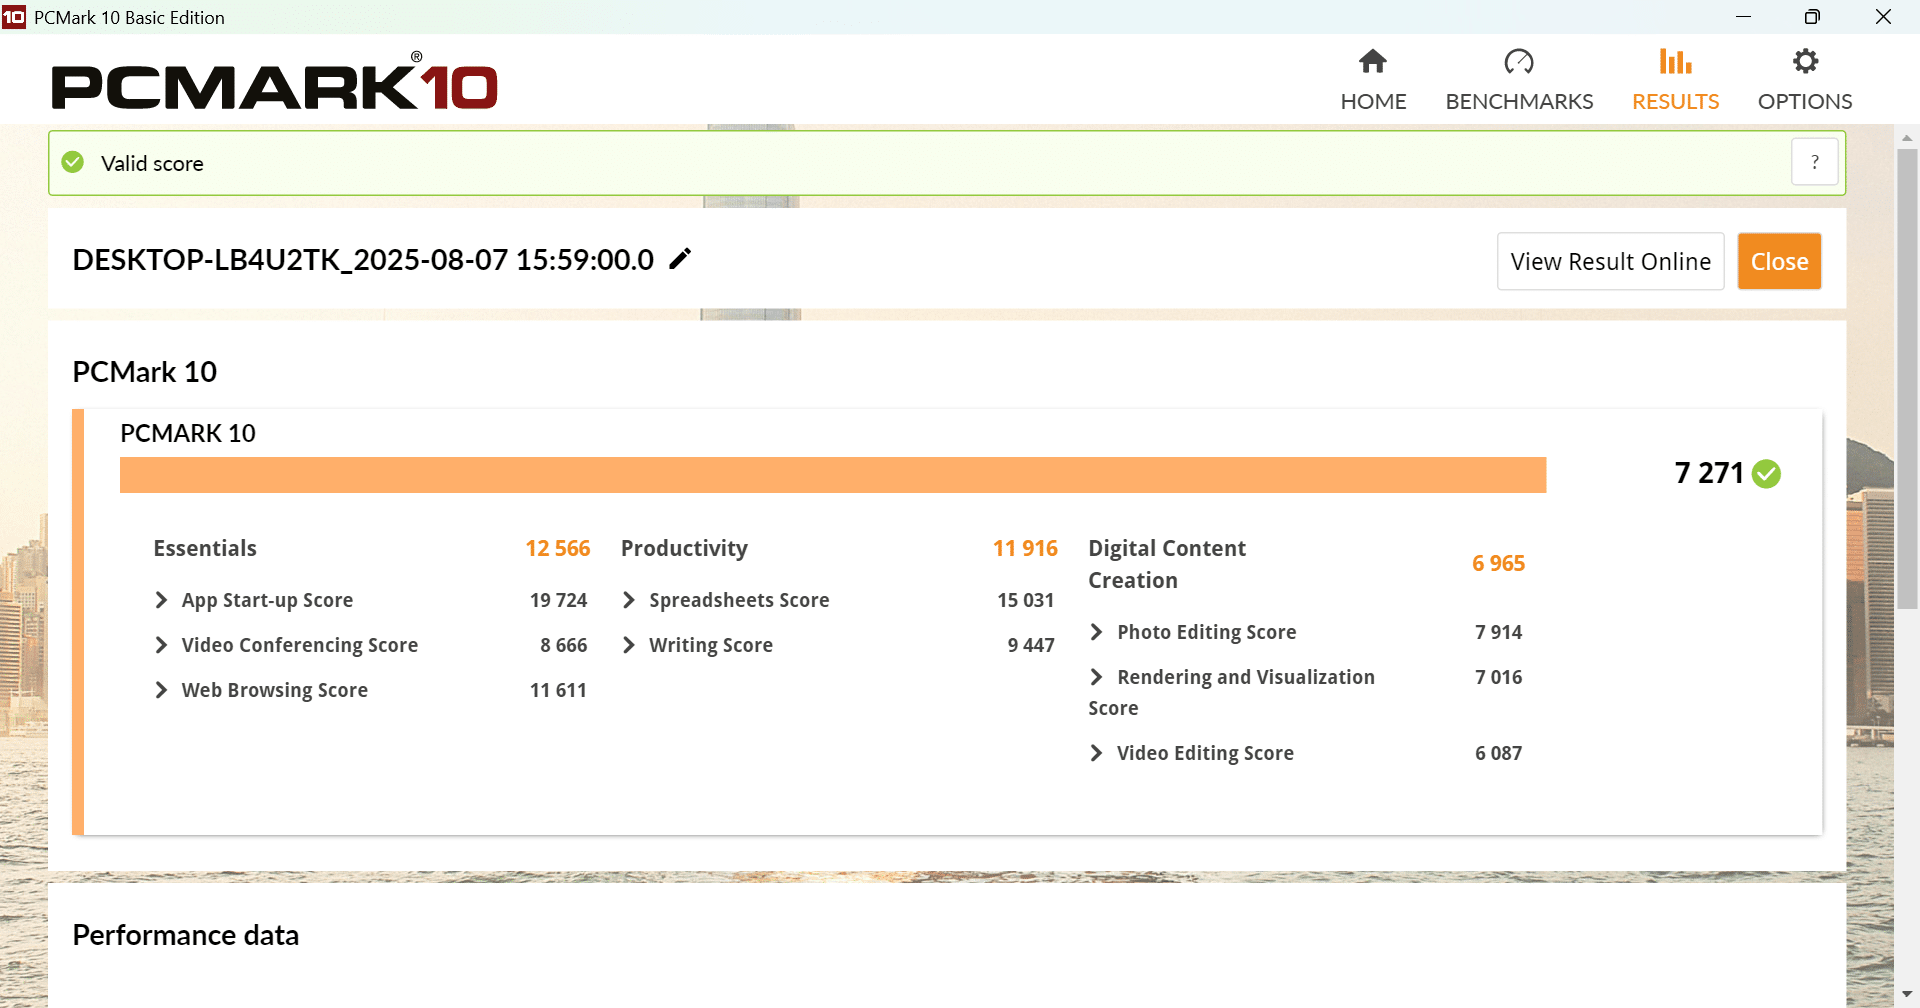
PCMark 10 shifts the focus to real-world productivity. Instead of focusing on a single component, it seamlessly integrates office tasks, web browsing, and creative workflows to reflect the kind of mixed-use scenarios most PCs face daily.
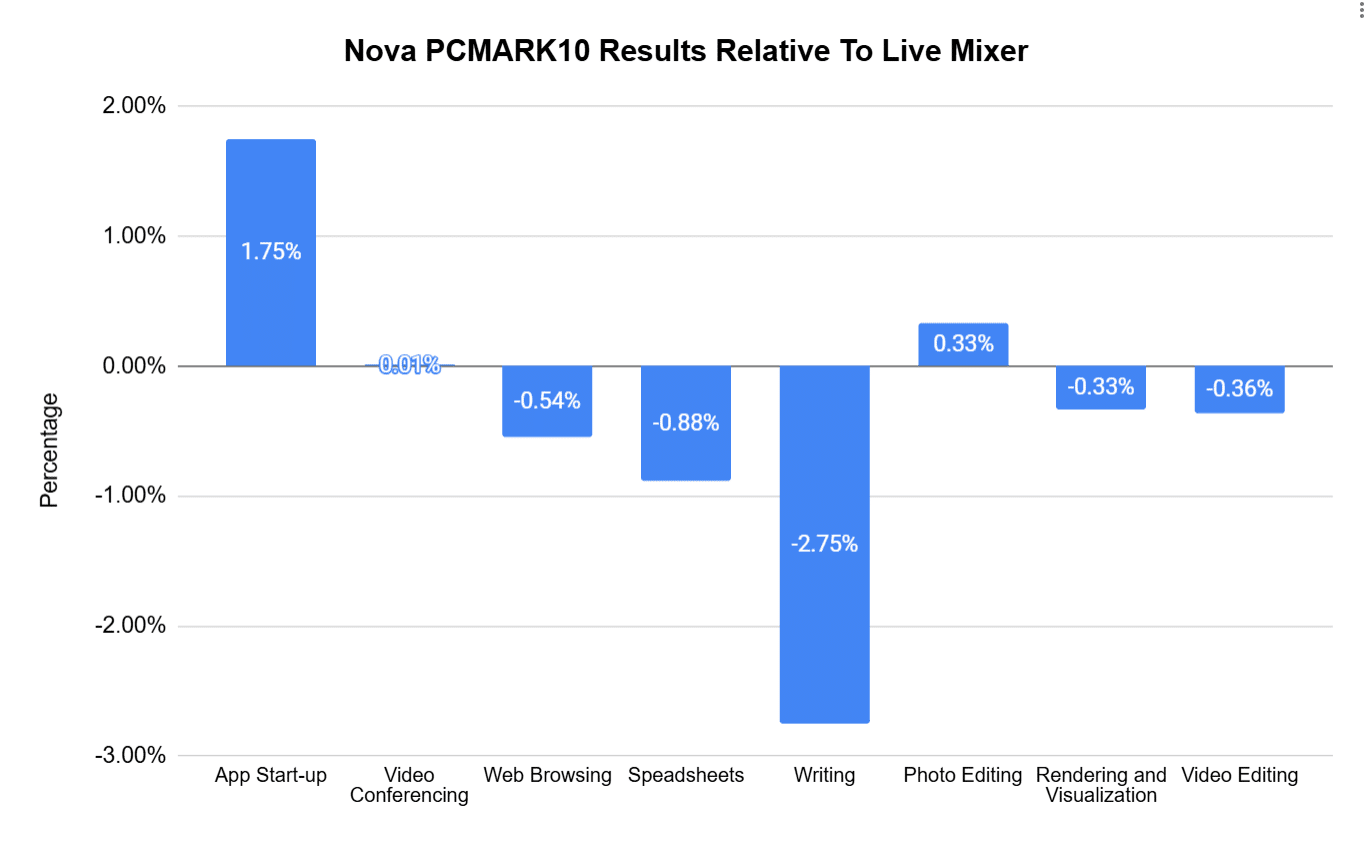
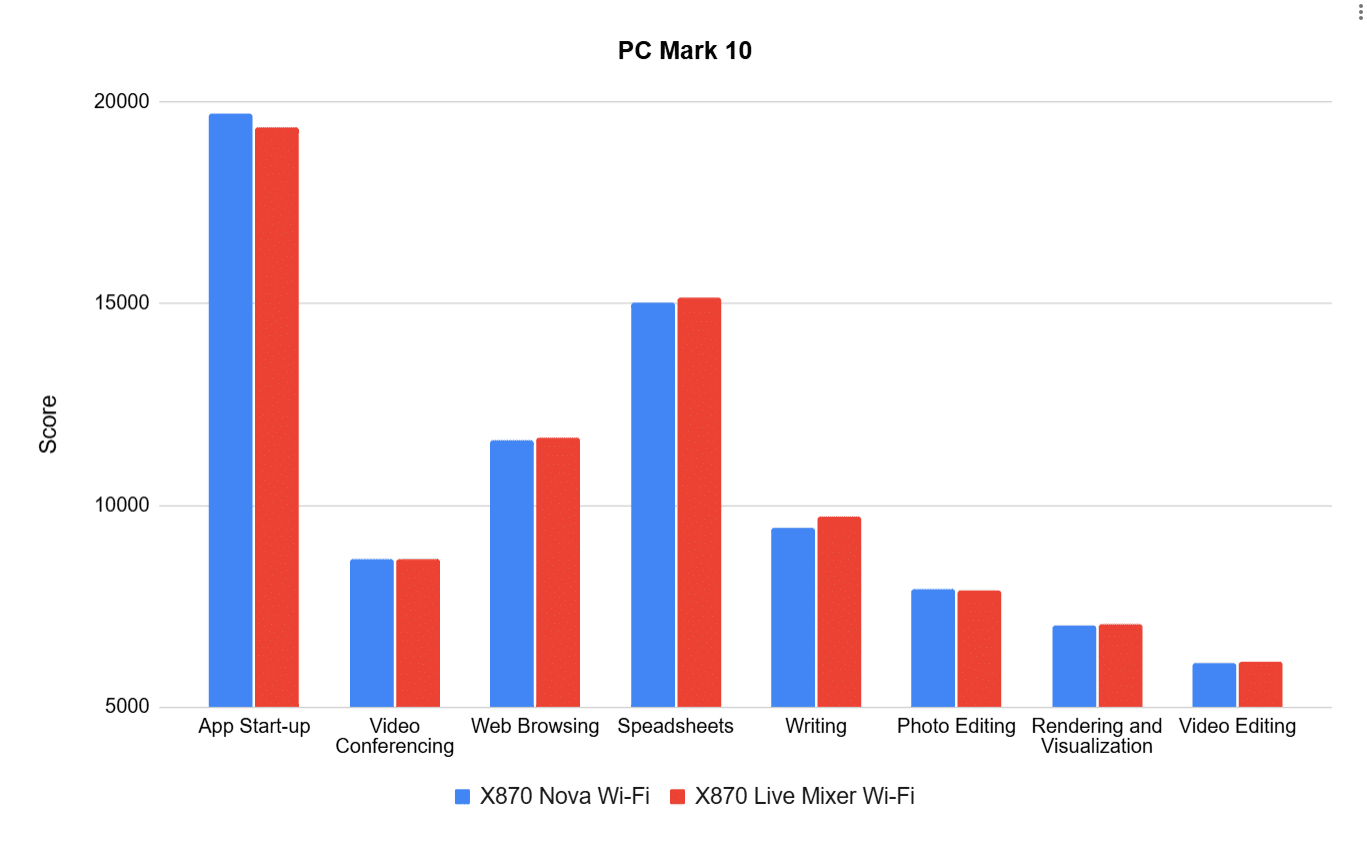
Once again, no significant differences were observed. The graph provides a visual representation of the results, with nothing particularly standing out.

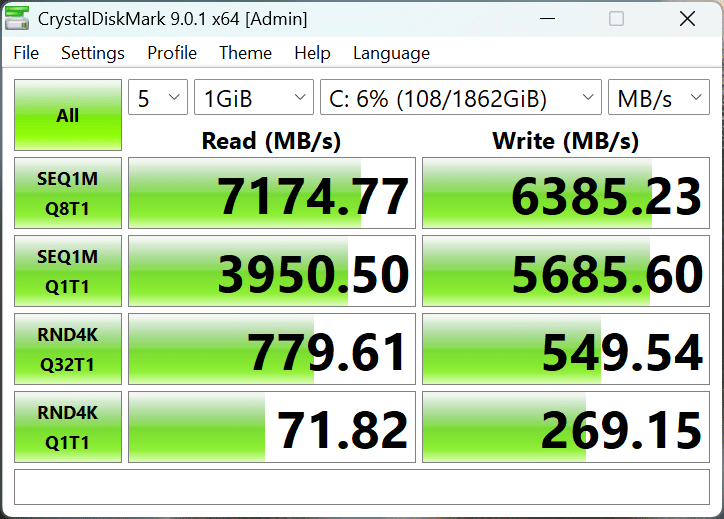
CrystalDiskMark is the go-to utility for measuring storage performance. Its sequential and random read/write tests dig into how quickly your system can move data, whether you’re loading massive game files or juggling thousands of tiny assets. Even though storage isn’t technically part of the motherboard, the board’s M.2 slots, PCIe lanes, and chipset handling can all influence the results. For storage, we used a Patriot P310 PCIe 4.0 NVMe drive, which doesn’t fully saturate the boards’ capabilities.
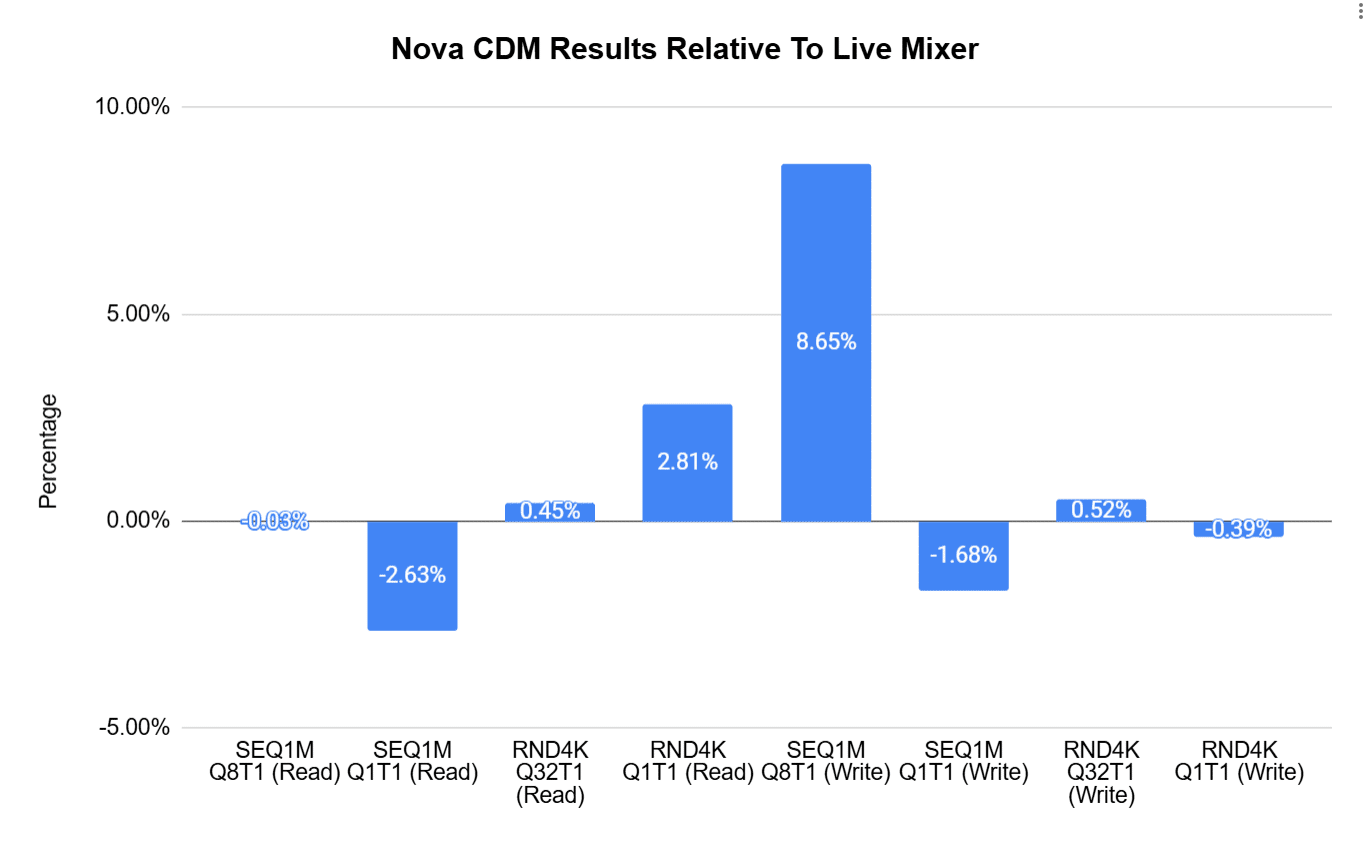
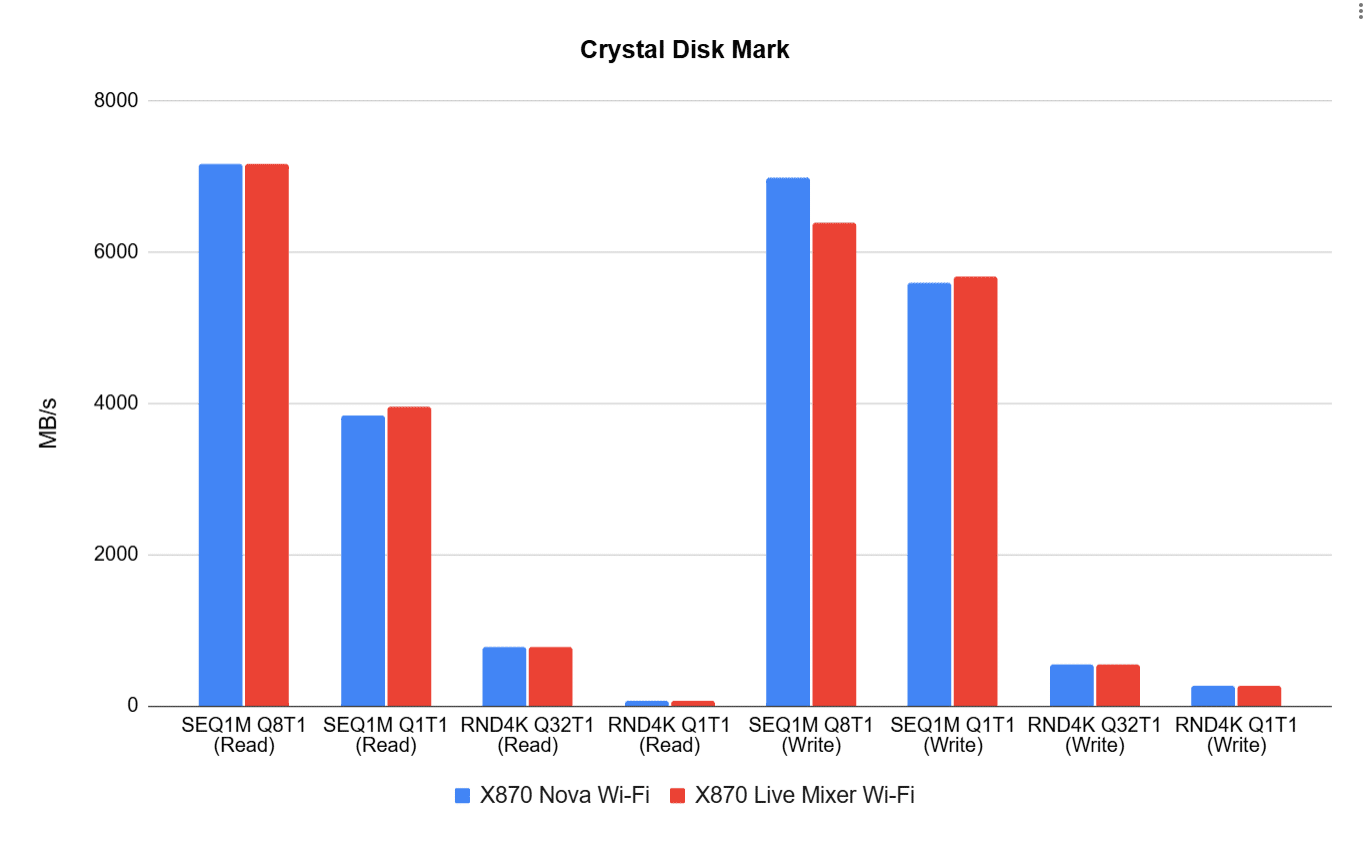
Both delivered very similar results at first glance, but on closer inspection, the two boards showed a significant difference in the SEQ1M Q8T1 test during writing.
| Specification | ASRock PG X870 Nova Wi-Fi | ASRock X870 Live Mixer Wi-Fi |
|---|---|---|
| Powered Off | 2.6 W | 1.8 W |
| Idle | 43.8 W | 42.7 W |
| Full CPU Load | 216.1 W | 209.1 W |
Power draw, measured with Prime95’s Small FFT option, was slightly higher on the Nova across all tests, despite using the same components and BIOS settings.