Since I will soon start extensive fan reviews, thanks to the Longwin apparatus that I bought, it is imperative to analyze some basic terms, besides the methodology that I will folow in my fan evaluations.
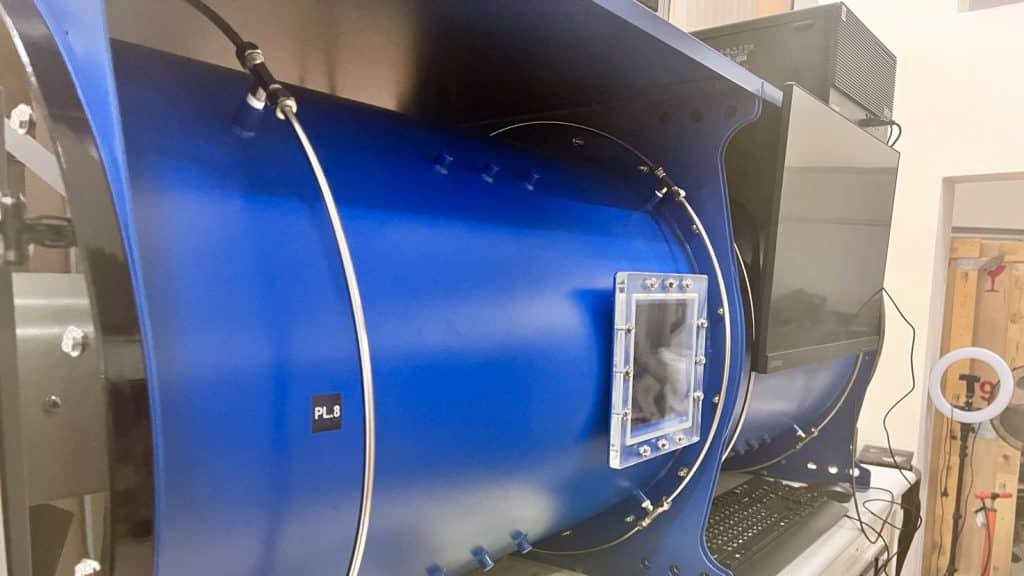
The main instrument I will use for my fan measurements is an LW-9266 Fan PQ performance measurement apparatus. This is a highly sophisticated scientific instrument made in Taiwan by Long Win. Besides the high asking price, which exceeded 62K dollars, including customs and shipping fees, there is a long waiting time since these machines are built to order.
- Manufacturer: Long Win Science & Technology Corporation
- Air flow rate: 2.4~250 CFM
- Accuracy of air flow rate: <3.5% INFS
- Repeatability error: < 2 %
- Static pressure: 0~20 mmAq (100 mmAq with the optional high static pressure throttle device)
- Overall dimension: 0.7 (W) × 2.2 (L) × 1.6 (H) m (Ref.)
- Operation space: 2 (W) × 3.5 (L) × 2 (H) m (Ref.)
- Power source: AC220V, 5 Amp, single phase, 50/60Hz
- Power 5V + 3.3v: 150W
- Based on Standards: ISO 5801-2007, AMCA 210-07, ASHRAE 51-2007, IEC 61591-2005, GB/T 1236-2000
I bought all extras with the LW-9266, including the high static pressure throttle device and the multi-fan electric performance test device. I will probably rarely use the last one, but I will have the first installed in the instrument in all cases.
So what the LW-9266 machine can do that I couldn’t do with a custom-made instrument? We must dive into the fan performance terms to answer this tricky question, starting with the P-Q curves.
Fan P-Q Curve
Every fan, whether DC or AC-powered and regardless of its dimensions, has a characteristic curve called P-Q. This curve shows the correlation between the fan’s airflow and its static pressure. With the letter “P,” we describe static pressure, and with “Q,” airflow.
When we refer to a fan’s airflow, we speak about the total amount of air the fan pushes/produces per unit of time. Airflow is usually measured in cubic feet per minute (CFM). Fan manufacturers provide a fan’s CFM in an open environment, without any obstacles in front of it, and this plays a huge role, as you will soon find out through my reviews. When there is no resistance in front of a fan, its airflow is maximum, but this is not the case for most fans, especially the ones used in heatsinks and AIO radiators. Mostly the fans that are used in chassis don’t face significant resistance.
The maximum static pressure is the fan’s wind pressure in a fully enclosed channel. Static pressure is the air pressure the fan can produce in an enclosure. Static pressure is measured in Pascals (Pa), inches of water (inH2O), or millimeters of water (mmAq). I will use the last.
The most important thing you need to know is that the fan will not simultaneously output maximum airflow and static pressure values. Airflow and static pressure have a negative correlation. When airflow increases, static pressure decreases, and when static pressure increases, airflow decreases.
Both airflow and static pressure have to do with airflow resistance, called impedance. When parts block the fan’s airflow, we have impedance, so to find out the complete P-Q curves of a fan, we have to be somehow able to simulate this impedance. Some users use custom-made filters or AIO radiators, but these techniques only simulate a single impedance scenario, so they cannot offer complete P-Q curves. The only way to get the entire P-Q curve of a fan is to have variable impedance, which is what an instrument like the LW-9266 does, based on established measuring standards and with full calibration reports.
The whole fan-testing procedure on a machine like the LW-9266 can be fully automatic or manual if you have the stomach for it. The provided software is relatively easy to use if you have devoted lots of time studying the supplied manuals, and given that you know what you are doing, else you won’t be able to check and interpret the results. I am still in a deep learning curve since fan testing so far for me was to evaluate fans on cooling solutions and take detailed noise measurements. Testing fan performance is new for me since I didn’t want to make a custom-made instrument with questionable and limited results but to get a proper one for the job. I built my first PSU load tester from scratch, making it better than several ready-made options, but building a fan-testing apparatus exceeds my engineering skills.
An interesting article about P-Q curves. It will take you less than five minutes to read, but you will learn some interesting stuff, including the “knee of the curve”!
The First Test Result
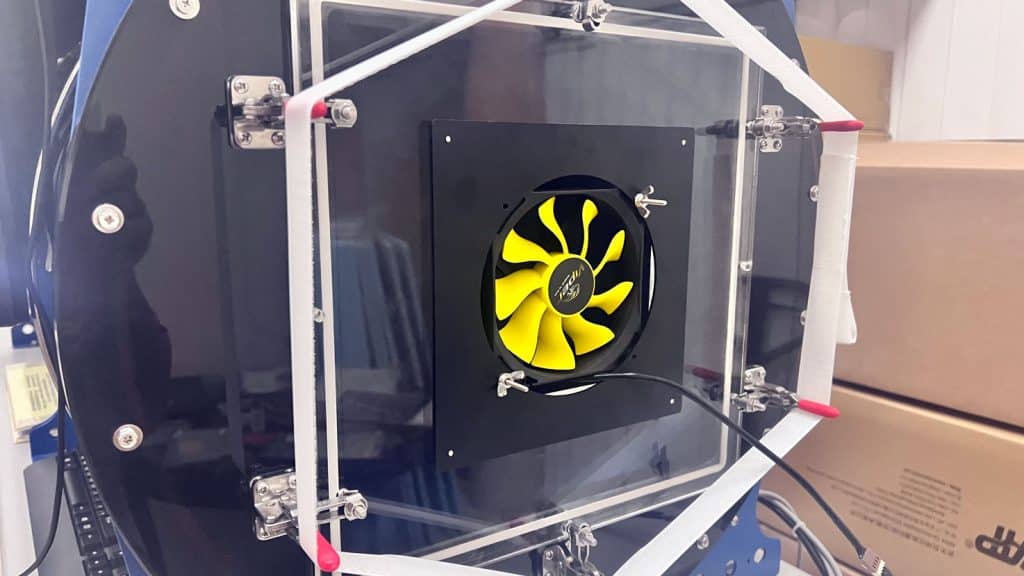
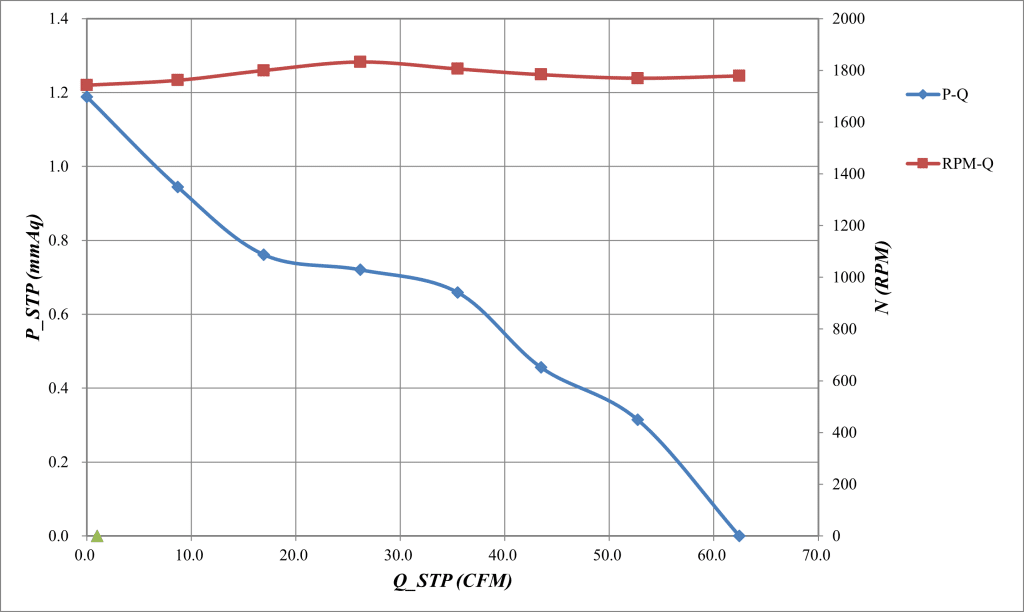
The first fan I threw in the machine was an Akasa Viper 120mm. You will find the P-Q and RPM-Q curves with 12V input below.
The official vs. measured specs are listed below:
| Metrics | Official Specs | Measured |
| CFM | 83.63 | 62.45 |
| Static Pressure | 2.98 | 1.17 |
As you can see, the official specs are far away from the ones I measured, especially the static pressure. I conducted the measurements a second time, only to get similar results with minimal deviation. This is just an example of how misleading a fan’s official specs can be, which won’t be the case anymore since I plan to evaluate every popular fan!
And some more details with 23.1℃ ambient temperature.
| mmAq | CFM | mmAq | mmAq | CFM | RPM | Volt | Amp. | Watt |
| 1.17 | 0.00 | 1.20 | 1.19 | 0.00 | 1743 | 12.00 | 0.16 | 1.86 |
| 0.93 | 8.72 | 48.00 | 0.94 | 8.72 | 1762 | 12.00 | 0.15 | 1.82 |
| 0.75 | 16.94 | 20.70 | 0.76 | 16.94 | 1800 | 12.00 | 0.15 | 1.76 |
| 0.71 | 26.18 | 49.00 | 0.72 | 26.18 | 1833 | 12.00 | 0.14 | 1.70 |
| 0.65 | 35.49 | 89.80 | 0.66 | 35.49 | 1806 | 12.00 | 0.15 | 1.74 |
| 0.45 | 43.46 | 33.50 | 0.46 | 43.46 | 1784 | 12.00 | 0.15 | 1.79 |
| 0.31 | 52.73 | 49.20 | 0.31 | 52.73 | 1770 | 12.00 | 0.15 | 1.81 |
| 0.00 | 62.45 | 68.90 | 0.00 | 62.45 | 1779 | 12.00 | 0.15 | 1.79 |
Epilogue
Although we all use dozens of fans in our systems, there is zero verified information on them, especially about their actual performance. High airflow fans are generally suitable for case fans, while static pressure fans are ideal for thick radiators and heatsinks with dense fins. The problem is that so far, there has been no detailed or accurate enough information on fan performance, which will change soon once I start fully exploiting the LW-9266 machine. I am so excited to enter a new testing field! Fans are everywhere, and we know so little about their actual performance! Time to change that!


Thank you for the answer. In fact, I have been going through the methodology and reviews, and while the data generated are good and there’s some useful information, I would like to offer some criticism. Given your excellent fan and noise testing equipment, I can’t help but feel there’s a lot of missed opportunities with the current fan testing methodology.
It’s impossible to correlate the results with real world performance. The maximum airflow and static pressure are listed, but you should know that those values only have weak correlations with the actual operating points. There’s P/Q curves at different PWM%, but without the impedance curves of various real obstacles, there’s no way to know what the operating points are.
Given that the Longwin machine has the capability of measuring impedence curves, I hope you’ll explore measuring such curves for various real world obstacles (different radiators, grills, mesh, or even a whole case for example), as well as to validate the impedence curves by comparing the calculated operating points and actual airflow of fans when mounted directly to the obstacle (both as push and pull). Only when the actual operating points could be determined would the results be applicable to real environments.
Next, noise tests could be done much better. First, the current lowest noise level tested is 20 dBA @ 1 m, which, for sensitive users like me, already correspond to being very noticeable, or even intolerable noise. It corresponds to 1476 RPM on the A12x25 for example, but for the best ears, the fan can already be heard starting from around 800 RPM. I strongly disagree that 15 dBA @ 1 m is “too low and wouldn’t make any sense”, as stated in the Silent Wings 4 review. Second, the noise of fans when mounted on different obstacles, especially when set as pull, also become very different and varies from fan to fan. Your current methodology is unable to capture this phenomenon. Third, the resolution of frequency plots are too low to capture very sharp frequency peaks that are the most annoying feature.
I would suggest adding a noise measurement point at much closer distances, say, 15 cm. This would allow for much higher sensitivity, lower possible noise-normalized values, and better frequency analysis. I understand that it deviates from the standard, which is why I suggest adding a separate measurement instead of replacing it. Standards are good for comparison purposes, but they can have their limitations. For instance, most PC cases are closer than 1 m to the user, and the use of multiple fans in the case will amplify the noise coming from the fans, which means the actual perceived noise level cannot be captured using the standard measurement method.
Noise-normalized tests should also be done separately on different obstacles, for reasons I have mentioned earlier. And lastly, the resolution frequency plots should be able to be tackled from the software side. TrueRTA, for example, allows for measuring 240 different frequencies.
I am a regular reader of HWcooling.net, and I believe they have the most comprehensive fan testing methodology on the internet, which you might be interested to know. Their fan testing author has great respect for you, and they’re the reason why I know you are doing excellent fan tests using the Longwin machine in the first place. Anyway, I hope my perspective is useful and you’d be able to use your equipment to their fullest potential.
Looking at the photo of the mounted Akasa fan, some area surrounding the fan does not seem to be sealed. Wouldn’t this affect accuracy of the results? Or are they actually sealed on the other side?
This was while I was learning the machine, had it for 1-2 days. Used the wrong plate there, but only to shoot a photo.