Clock Speeds
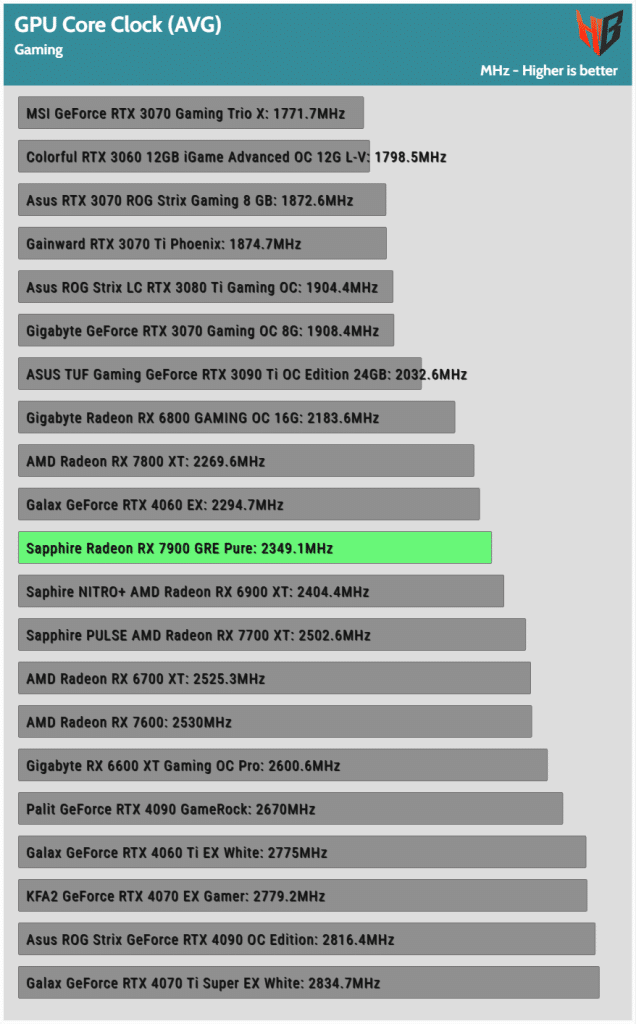
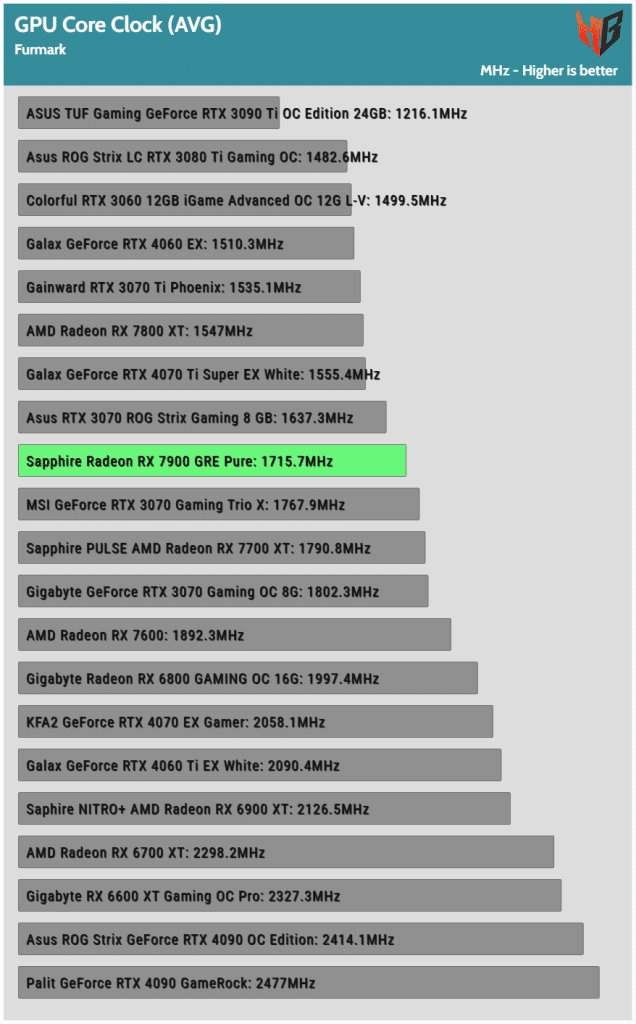
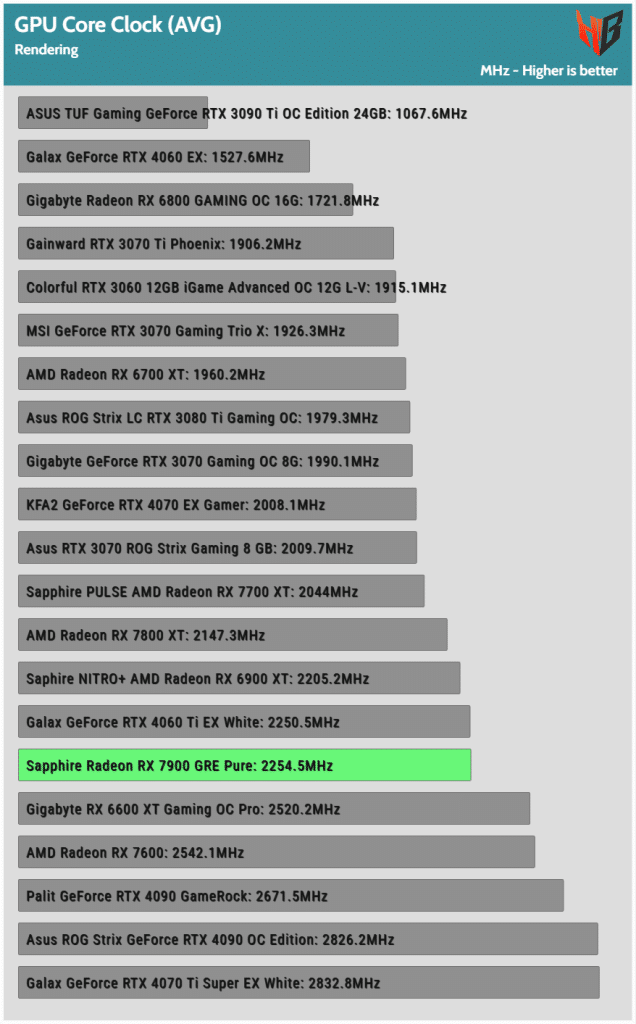
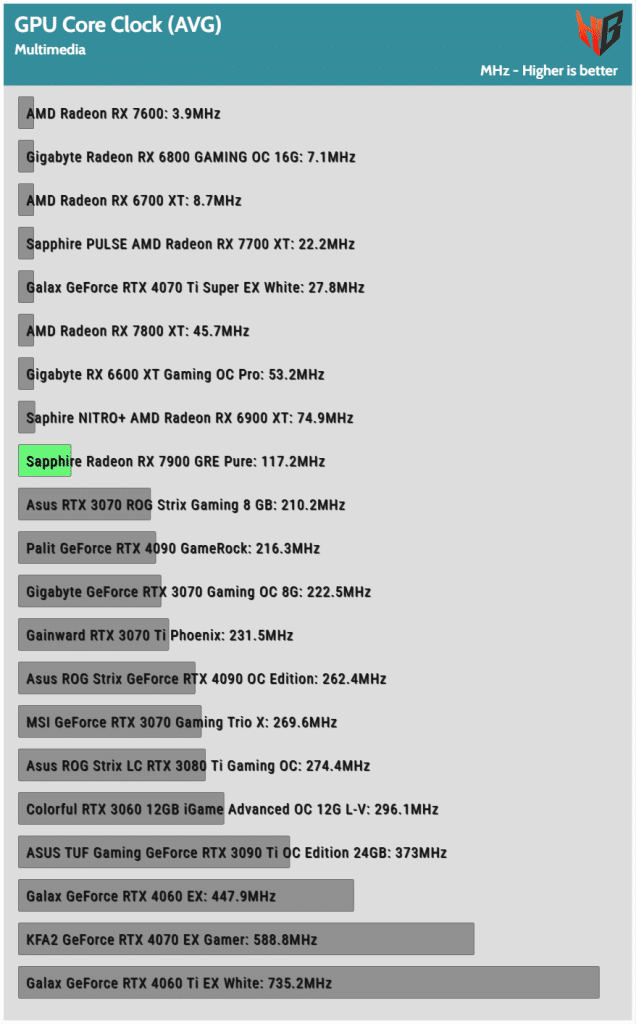
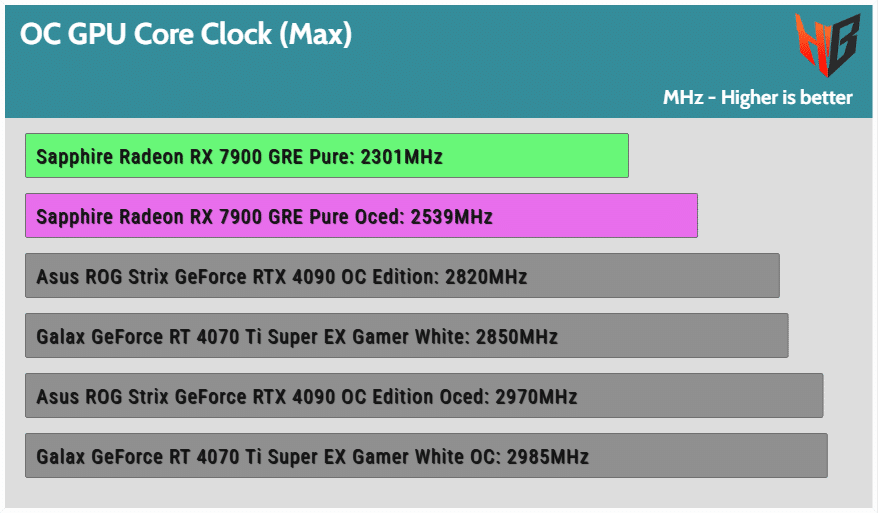
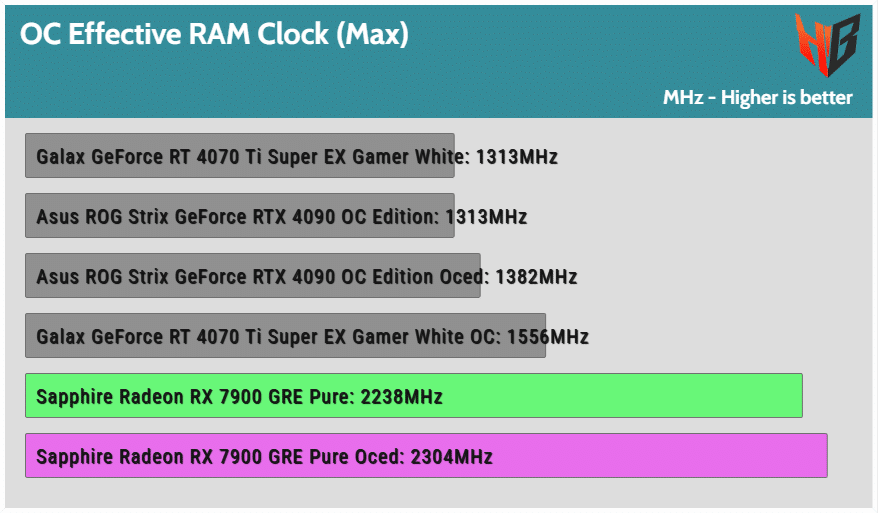
The charts below show the average GPU clock speeds in various usage scenarios.
Overclocking
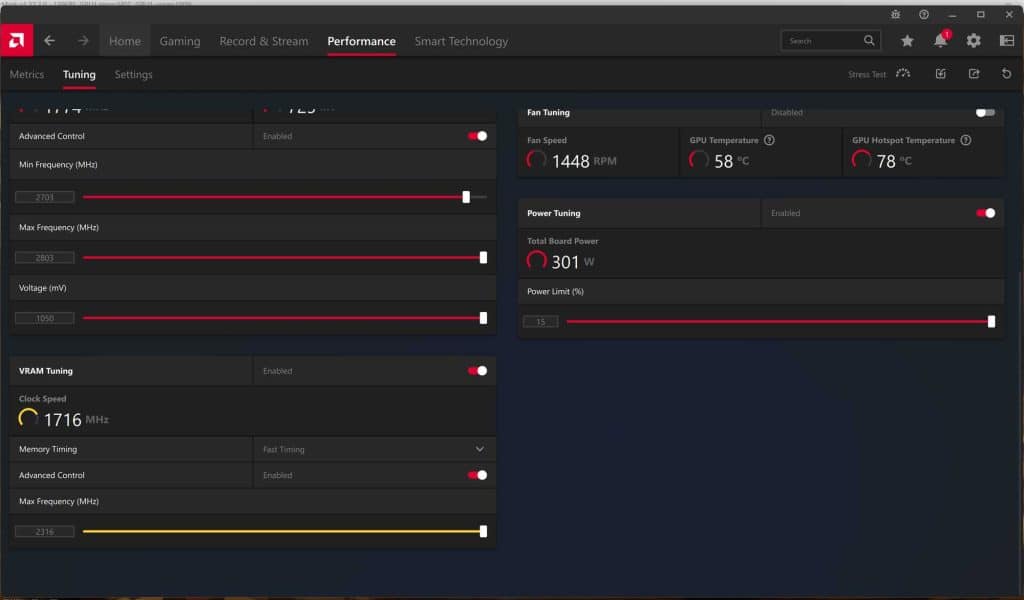
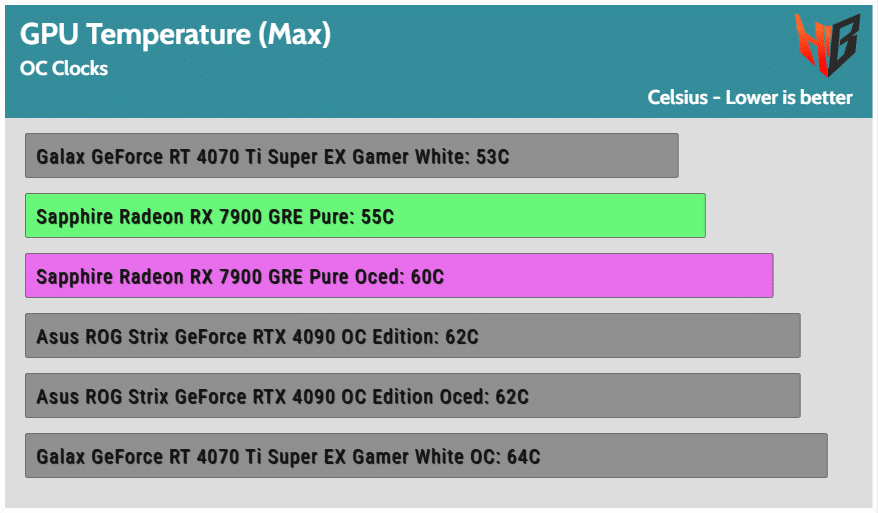
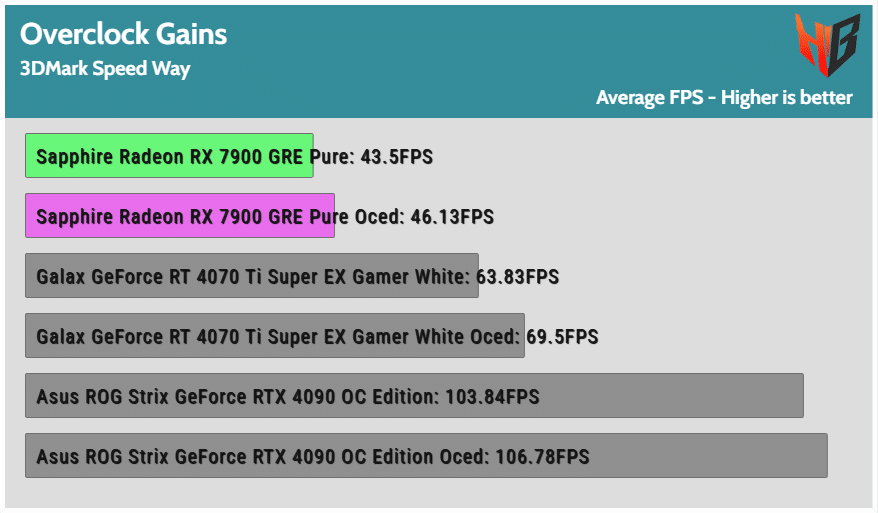
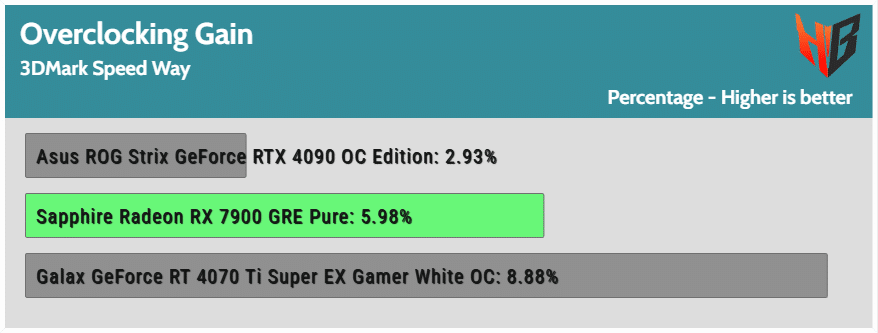
Overclocking is easy with this card since the AMD drivers don’t give you much headroom anyway. Most likely AMD did that on purpose, not to have the GRE reach close enough to the RX 7900 XT performance through overclocking. I dialed the maximum allowed GPU, RAM, and power limit values. I run the 3DMark Speed Way benchmark to determine the overclock gains.
GPU & RAM Clocks
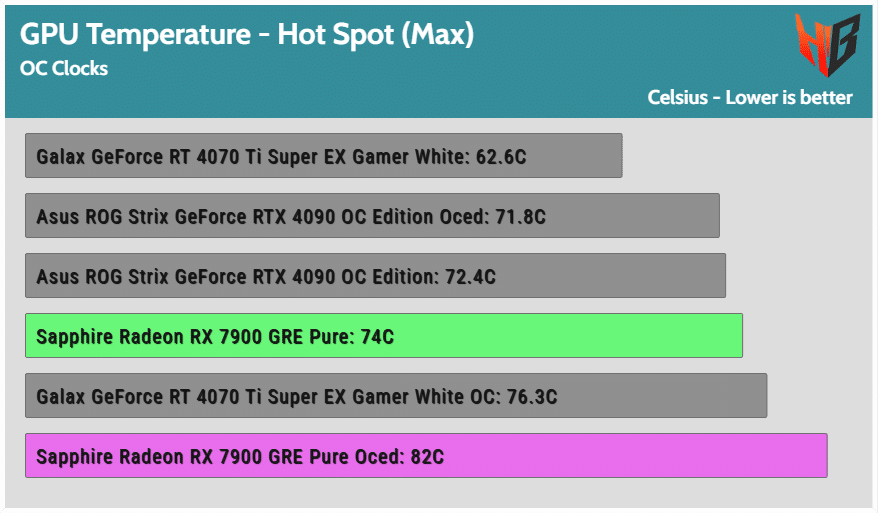
Operating Temperatures
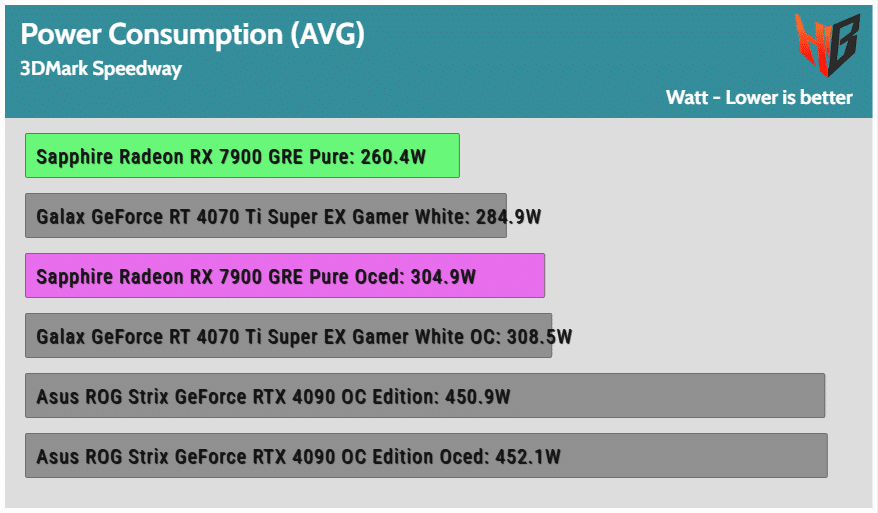
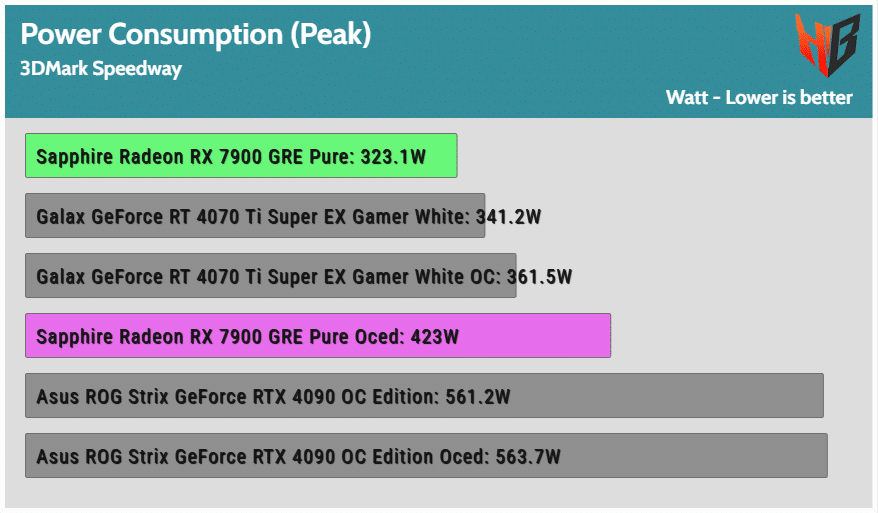
Power Consumption
The power consumption is notably higher.
Overclock Gain
For a 6% performance increase, you need 44.5W. You could possibly lower this amount by dialing down the GPU core voltage. Personally, I don’t believe it is worth the trouble to push this card, or any card, to its limits. Just buy a stronger one.
- Prologue & Technical specifications
- AMD’s Key Technologies
- Box & Contents
- Part Analysis
- Specifications Comparison
- Test System
- Game Benchmark Details
- Raster Performance
- RT Performance
- RT Performance + DLSS/FSR Balanced
- Raytracing Performance + DLSS/FSR Balanced + FG
- DLSS/FSR Balanced (No RT)
- DLSS/FSR Balanced + FG (No RT)
- Relative Perf & Perf Per Watt (Raster)
- Relative Perf & Perf Per Watt (Raster + DLSS/FSR)
- Relative Perf & Perf Per Watt (RT)
- Relative Perf & Perf Per Watt (RT + DLSS/FSR)
- Relative Perf & Perf Per Watt (RT + DLSS/FSR + FG)
- Rendering Performance
- Operating Temperatures
- Operating Noise & Frequency Analysis
- Power Consumption
- Clock Speeds & Overclocking
- Cooling Performance
- Epilogue


“RT performance stays notably behind NV’s corresponding offerings”
Not in the same price range. Terrible review