The Asus ROG Strix RTX 4090 OC Edition is one of the most expensive and most powerful graphics cards that money can get you today. Thanks to Powenetics V2 I am able to offer you a complete power analysis, and also advice you on which power supply is ideal for this beast of a card. Lastly, I make a comparison with the power results that I got from the Palit GameRock RTX 4090, one of the most affordable RTX 4090 implementations.
In a previous power analysis article, I used a Palit GameRock RTX 4090. Some of you complained that this is among the weakest RTX 4090 implementations, asking me to check a higher-end implementation. Thanks to Asus, I have a Rog Strix RTX 4090 OC Edition in my hands, which is among the best implementations, if not the best. With the Powenetics V2, which can take more than 1000 readings per second on all of its sensors for both voltage and current, nothing will remain hidden regarding power consumption. Read the rest of the article to see how many Watts the Rog Strix asks under normal and overclocked speeds in various games. This will make easier the PSU selection. You will also be surprised by the Asus card’s power results compared to the Palit card’s ones.
Test System
| Test System Specs | ||||
| Mainboard | ASUS Prime Z690-A Bios Version 0702 (10/22/2021) |
|||
| CPU | Intel® Core™ i9-12900KF (all cores @ 5 GHz ) |
|||
| GPU | Asus ROG Strix RTX 4090 OC, Palit RTX 4090 GameRock OC | |||
| SSD | XPG SX8200 Pro 2 TB NVMe | |||
| RAM | Corsair Vengeance LPX DDR5 32GB (2 x 16GB) 5200MHz | |||
| Power Supply | Seasonic Prime Titanium 1000 (Cybenetics Titanium) | |||
| Case | DimasTech Bench | |||
| Ambient Temperature | 25°C ±1°C | |||
| Drivers | Nvidia: 526.98 | |||
Test Results – Palit RTX 4090 Gamerock OC vs. Asus Rog Strix RTX 4090
The averages of the above results are the following:
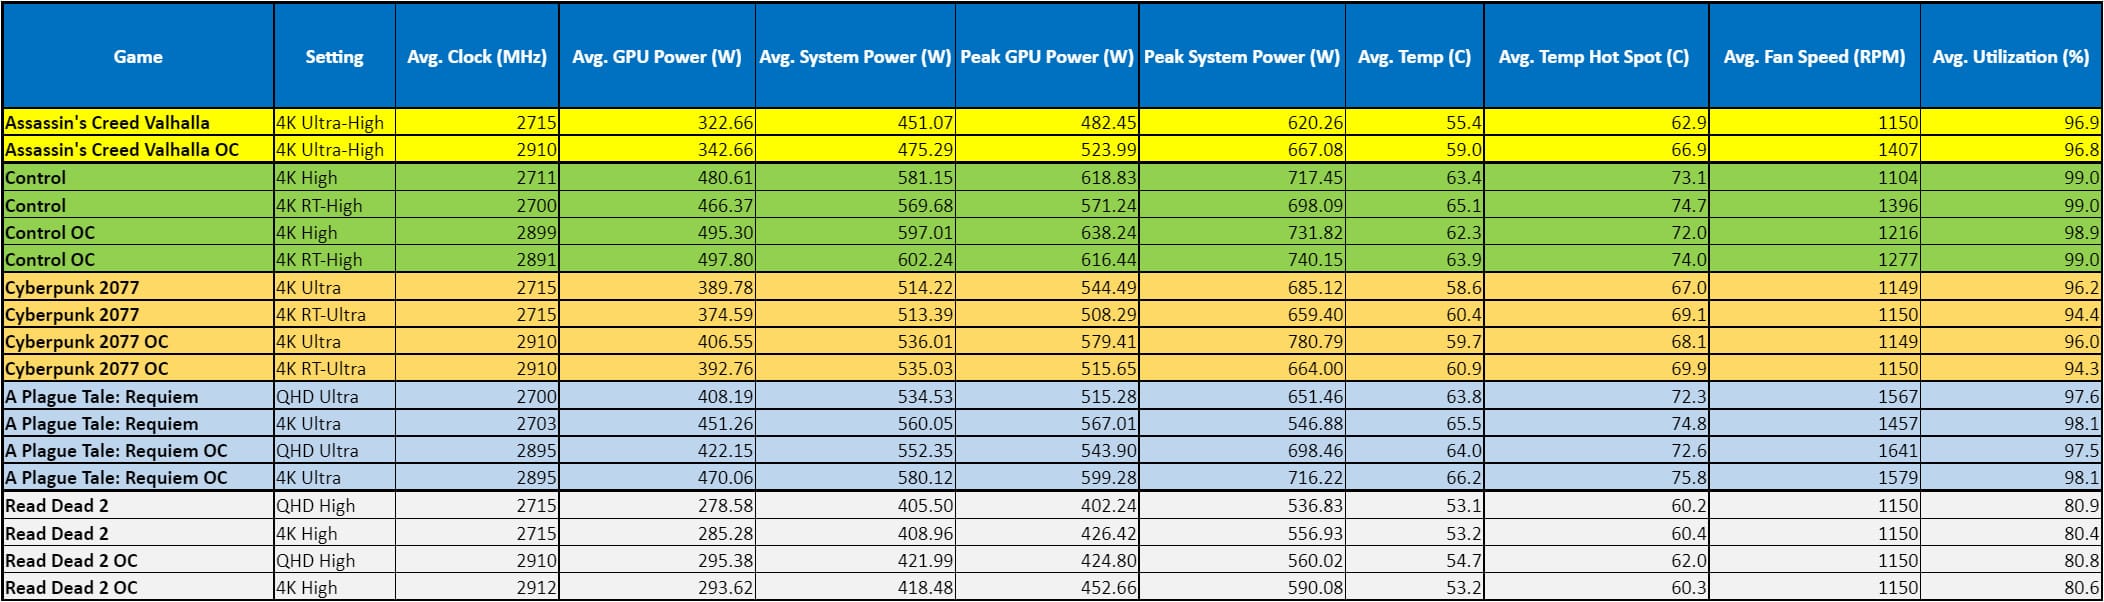
Palit RTX 4090 Gamerock OC |
|
Stock Speeds |
OC Speeds |
|
|
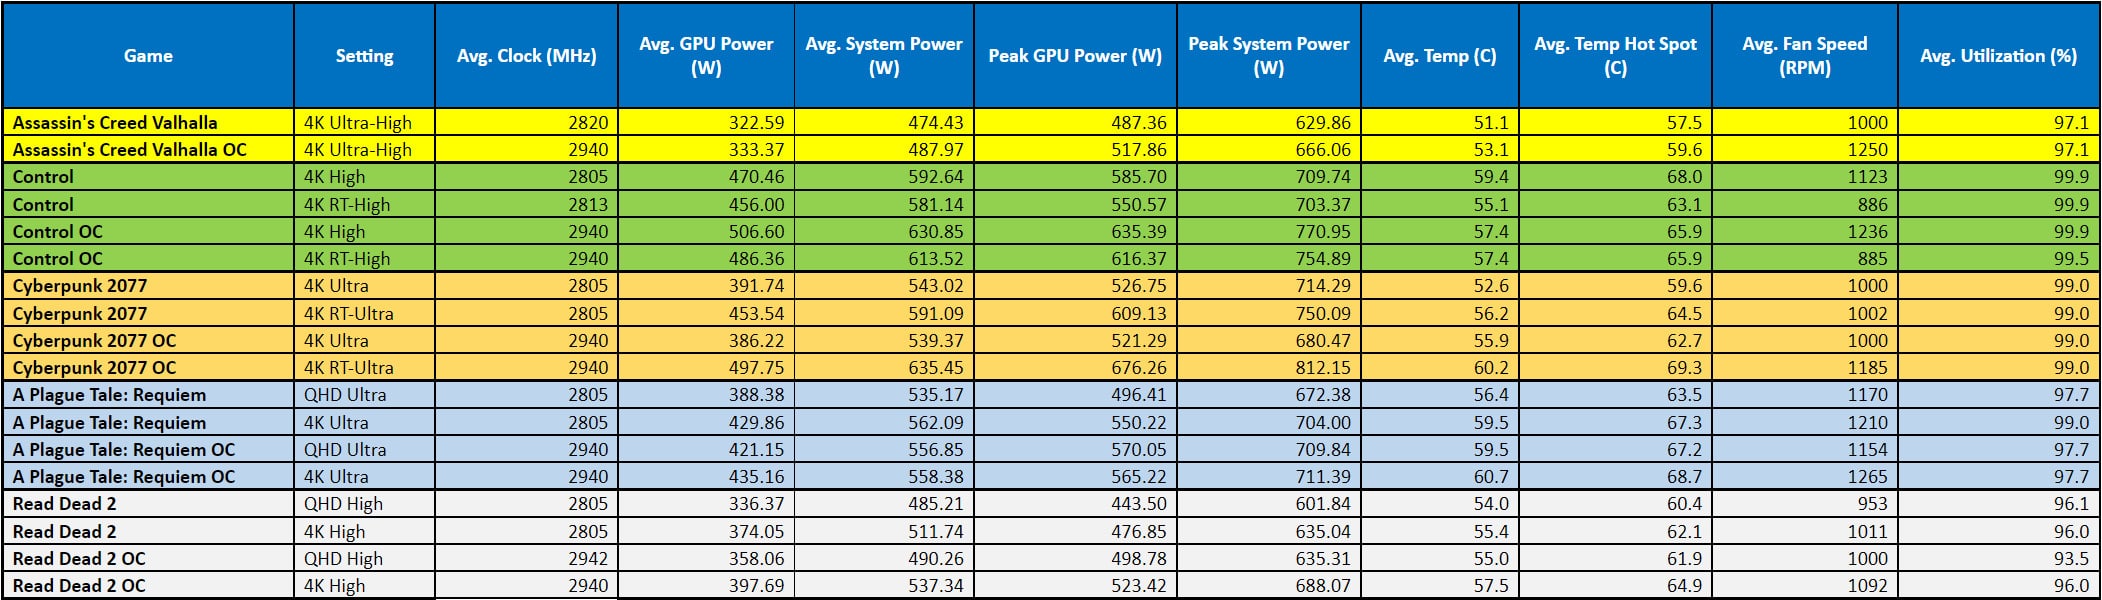
Asus ROG Strix RTX 4090 OC |
|
Stock Speeds |
OC Speeds |
|
|
The average GPU power consumption for all games I ran with the Asus card is 402.55W, slightly above 400W. With OC speeds, it goes close to 425W. Control applies high stress to the GPU, but the game with the highest energy demands proved Cyberpunk with RTX enabled. While the average GPU and system power readings were close to Control, the peak values (power spikes) were much higher.
In the worst-case scenario, OC speeds, the maximum GPU peak power for the Asus Rog Strix is at 676.26W, which is higher than Palit’s corresponding reading (638.24W). Still, we should consider the higher GPU overclock speeds that the Rog Strix achieved (2903.52MHz average speed vs. 2940.21 MHz). Nevertheless, the inferior VRMs of the Palit card, compared to the ones that the Asus card uses, don’t seem to be a problem for power spikes. This makes me wonder if we really need such powerful VRMs even on the RTX 4090 implementations. Unless you use liquid nitrogen to achieve your overclocks along with a 2KW power supply for the GPU alone, most likely not.
The maximum power reading of the whole system was 812.15W which is a bit higher than Palit’s, which scored 780.79W. This means an 850W PSU of good quality and above-average performance will be enough for both cards, even with a powerful CPU installed, like the Intel 12900KF I used in my test system.
Buy MSI Gaming GeForce RTX 4090 Buy NVIDIA GeForce RTX 4090 FE Buy ZOTAC Gaming GeForce RTX 4090 Buy ASUS TUF Gaming GeForce RTX 4090 OC

I tried yesterday 3D Mark with a 5900x ryzen and an 6950xt amd reference card. I saw maximum wattage output from my psu 680. I checked with the hardware info the maximum card wattage, it was something close to 340-350 and 130 with 150 for the cpu. My question is where was the other wattage came from? For psu, I have a corsair hx1000i 2022 model.
Don’t trust to much the Wattage readings that the PSU delivers.