Overclocking the fresh AMD RX 7900 series GPUs is not as easy as it sounds. If you don’t dial the correct settings, instead of higher performance, the cards will lose performance, significantly. I will provide all relevant details in this article, along with a full power analysis which will shed more light to the VRAM lower clocks issue under high GPU speeds.
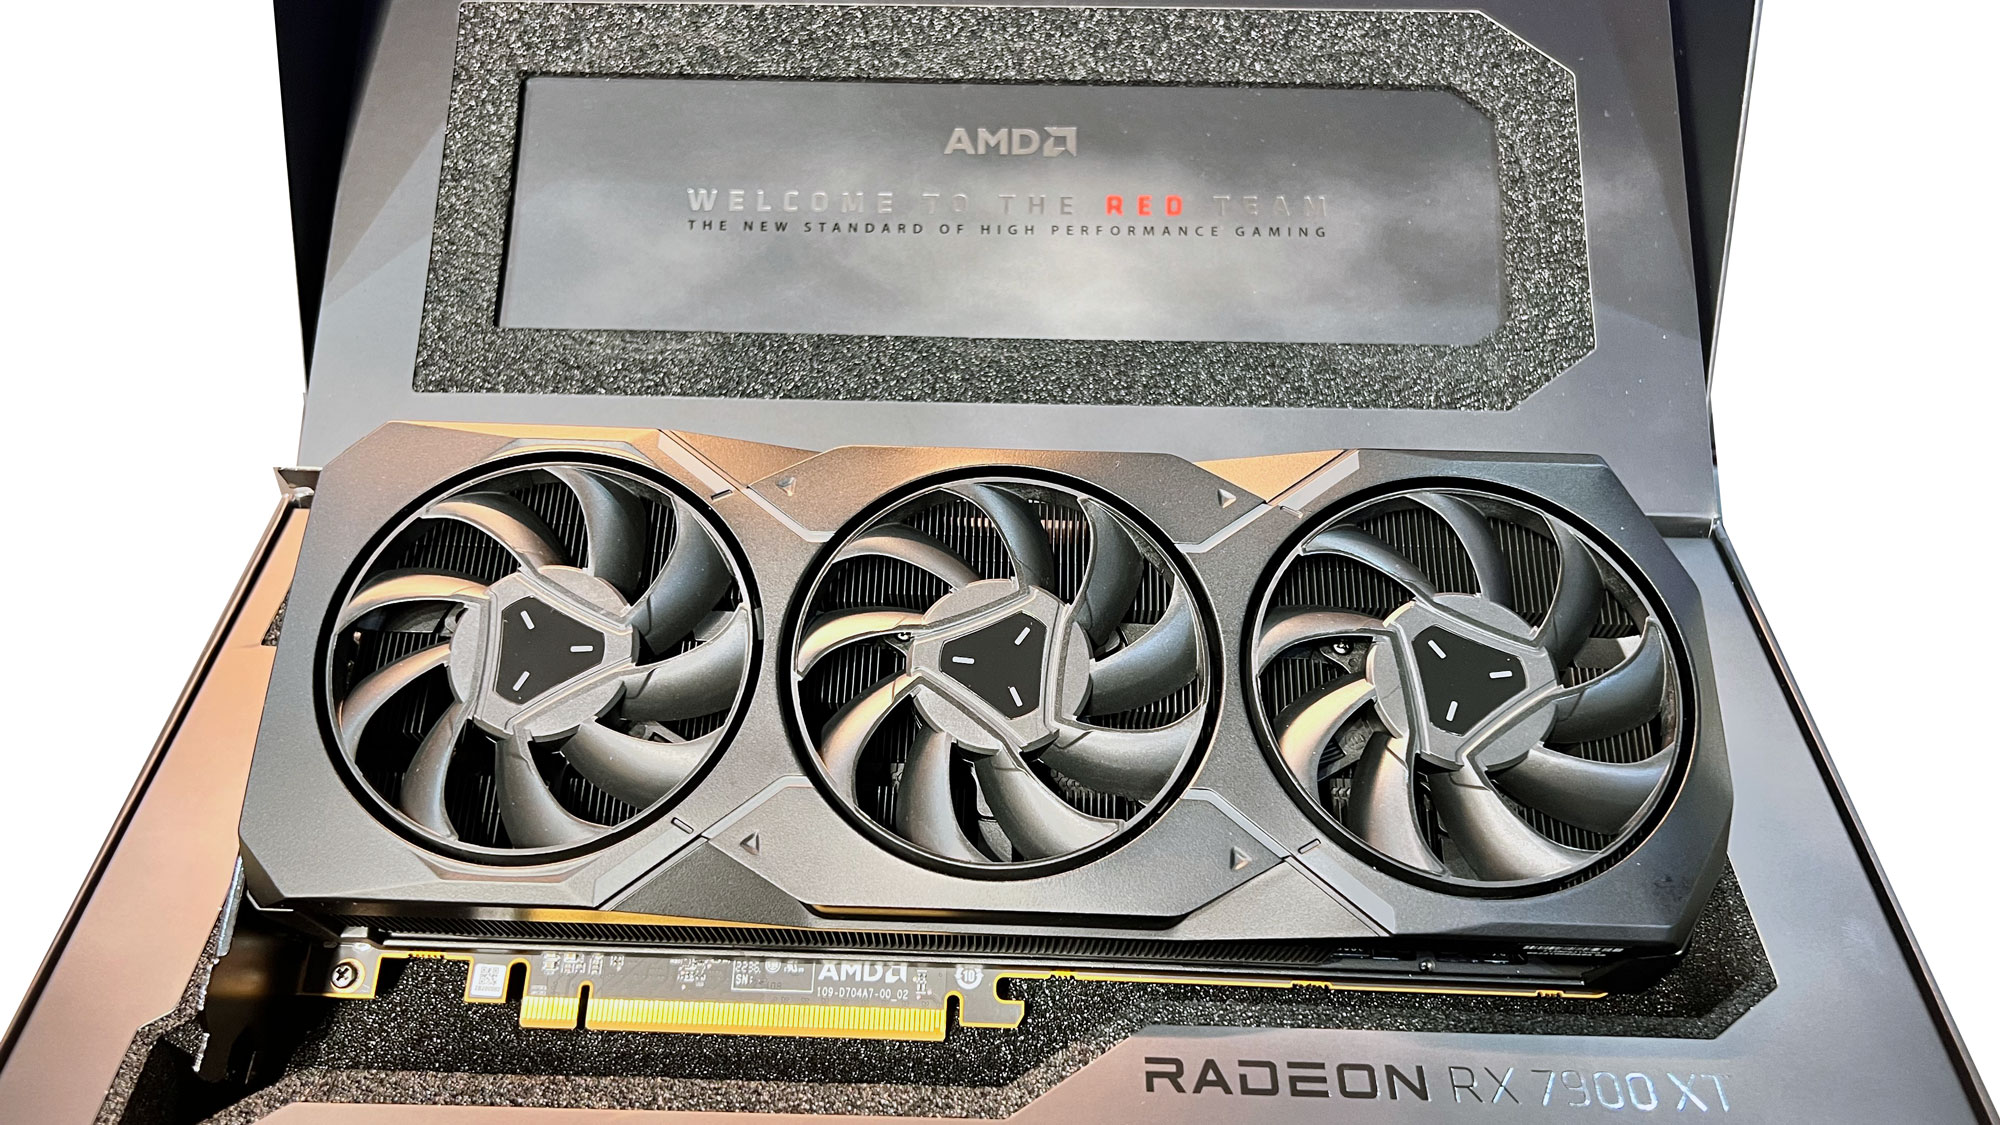
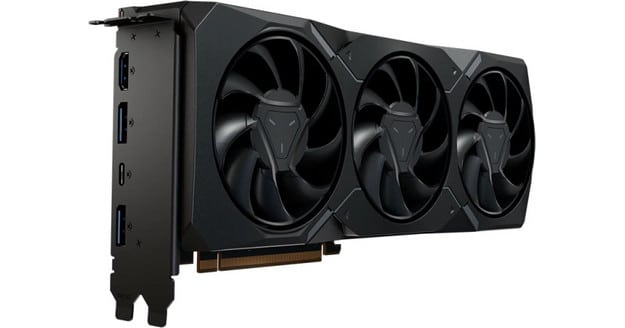
I finally have the AMD Radeon RX 7900 XT in my hands. Despite the limited time during this period because we are moving to a new country, I found the time for a complete power analysis and a detailed overclocking guide. The RX 7900 series need attention if you decide to overclock it. I soon discovered that you could lose a lot instead of performance gain if you don’t apply the correct settings. Also, overclocking is not as easy as it should be because of the min and max sliders AMD uses for GPU speeds and the max slider for VRAM clocks. AMD should improve its tuning utility and make it more user-friendly. Even in auto mode, you can either select GPU auto clocks or VRAM auto. No option overclocks automatically because GPU speeds seriously affect VRAM speeds! This is something that JayTwoCents found out first in this video. I will take it from there and try to understand what is going on because I will use an advanced GPU power analyzer, Powenetics V2 rev 04, which monitors and logs everything with a lower than 1ms polling rate!
Test System
| Test System Specs | ||||
| Mainboard | ASUS Prime Z690-A Bios Version 0702 (10/22/2021) |
|||
| CPU | Intel® Core™ i9-12900KF (all cores @ 5 GHz ) |
|||
| GPU | AMD Radeon RX 7900 XT | |||
| SSD | XPG SX8200 Pro 2 TB NVMe | |||
| RAM | Corsair Vengeance LPX DDR5 32GB (2 x 16GB) 5200MHz | |||
| Power Supply | Seasonic Prime Titanium 1000 (Cybenetics Titanium) | |||
| Case | DimasTech Bench | |||
| Ambient Temperature | 25°C ±1°C | |||
| Drivers | AMD: Adrenaline 22.11.2 | |||
Besides the usual application for full load testing, the power virus called Furmark. I will also use Uniqine Heaven to evaluate the overclock gains (or losses) and check power consumption, GPU and VRAM speeds, temperatures, and many more. This is going to be a long ride, so stay with me.
Pushing it to the limit (Furmark)
Furmark |
|
Stock Speeds |
Stock Speeds +15% Power Limit |
|
|
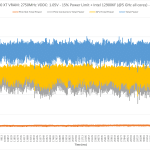
The conclusions from the above results:
- An increase in the power limit heavily affects GPU speeds (with a stock VRAM clock).
- 15% power limit increase in real life is 17.37%.
- AMD speaks for 315W typical board power, which aligns with the 314.65W average power that I measured with the stock power limit.
- The average GPU hot spot temp increases notably, 8.45 °C, with a +15% power limit.
- Max GPU hot spot temp is dangerously close to 90 °C
- The difference in average and max fan speeds is low. A more aggressive fan speed profile would lower the operating temperatures.
For those of you who love charts:
Overclocking Results – Unigine Heaven
Uniqine Heaven Benchmark 4.0 (Default Power Limit) |
|
Stock Speeds |
GPU: Stock Speed
|
|
|
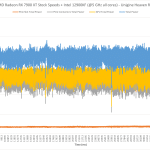
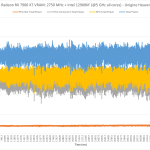
The conclusions from the above results:
- With a higher VRAM speed, the average GPU speed drops notably.
- The card runs cooler with the VRAM set at 2750 MHz, with the GPU clock stock (because AVG GPU clocks are lower).
- VRAM speed increase doesn’t notably affect the average and peak power readings.
- In both cases, the average GPU Power is below AMD’s typical board power of 315W.
- With 2750 MHZ RAM, the average fan speed notably drops.
- The maximum fan speed is increased at 2000 RPM.
Uniqine Heaven Benchmark 4.0 (+15% Power Limit) |
||
Stock Speeds |
GPU: Stock Speed
|
GPU: Stock Speed
|
|
|
|
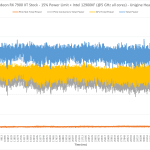
The conclusions from the above results:
- An increase in the power limit doesn’t offer anything at stock speeds. Power consumption remains the same, too.
- With VRAM at 2750 MHz and stock GPU clocks, the power limit increase leads to higher GPU clocks, which don’t seem to provide something meaningful to performance compared to the same clocks and stock power limit. This is weird!
- The power limit increase affects board power with overclocked RAM speeds and stock Vcore.
- With 2750 MHZ RAM, the average fan speed notably drops.
- The fans’ speed is increased at 2000 RPM.
- Undervolting notably affects overall board power, but peak system power is about the same.
- Undervolting lowers the avg GPU hot temp by 2 degrees. Not bad!
- Undervolting with the GPU clocked at stock speeds doesn’t increase performance.
Uniqine Heaven Benchmark 4.0 (+15% Power Limit) |
|
GPU: 2800 MHz (min)
|
GPU: 2900 MHz (min)
|
|
|
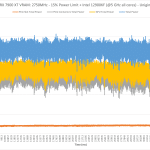
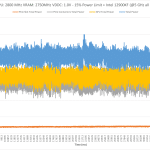
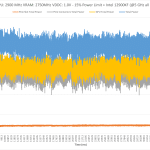
The conclusions from the above results:
- A not optimal GPU speed setting can lead to performance loss, even when it doesn’t affect VRAM speed (sky-high GPU speeds drop VRAM clock)
- You must select min and max GPU clocks carefully and, ideally, provide a large space between these values (400-500 MHz).
General Conclusions & Overclocking Advice
It took me several hours of benchmarking to draw the following conclusions:
- The average power draw of the RX 7900 XT is in line with what AMD claims.
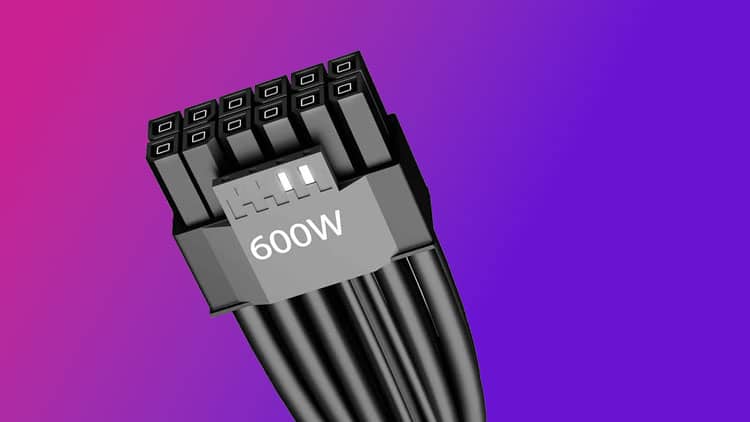
- The peak power consumption I measured was 597.37W during Furmark and with a +15% power limit. For comparison purposes, with increased power limits, the Palit Gamerock RTX 4090 peaked at 618.83W, and the Asus ROG Strix RTX 4090 OC 609.13W. AMD’s card has high peaks despite the “only” two PCIe 6+2. It desperately needs a third PCIe 6+2 or, even better, a 12+4 pin.
- Fan speeds are high, leading to increased noise output.
- Undervoltage notably affects power consumption but needs to be combined with the optimal GPU clock.
- You can set VRAM speed up to 2750 MHz without any issues. Higher clocks were a no-go for my system.
- If you apply sky-high GPU clocks, VRAM speed will drop notably to keep overall power consumption in line.
- The easiest overclocking you can do is just to set VRAM at 2750 MHz and leave everything else in stock, even the power limit.
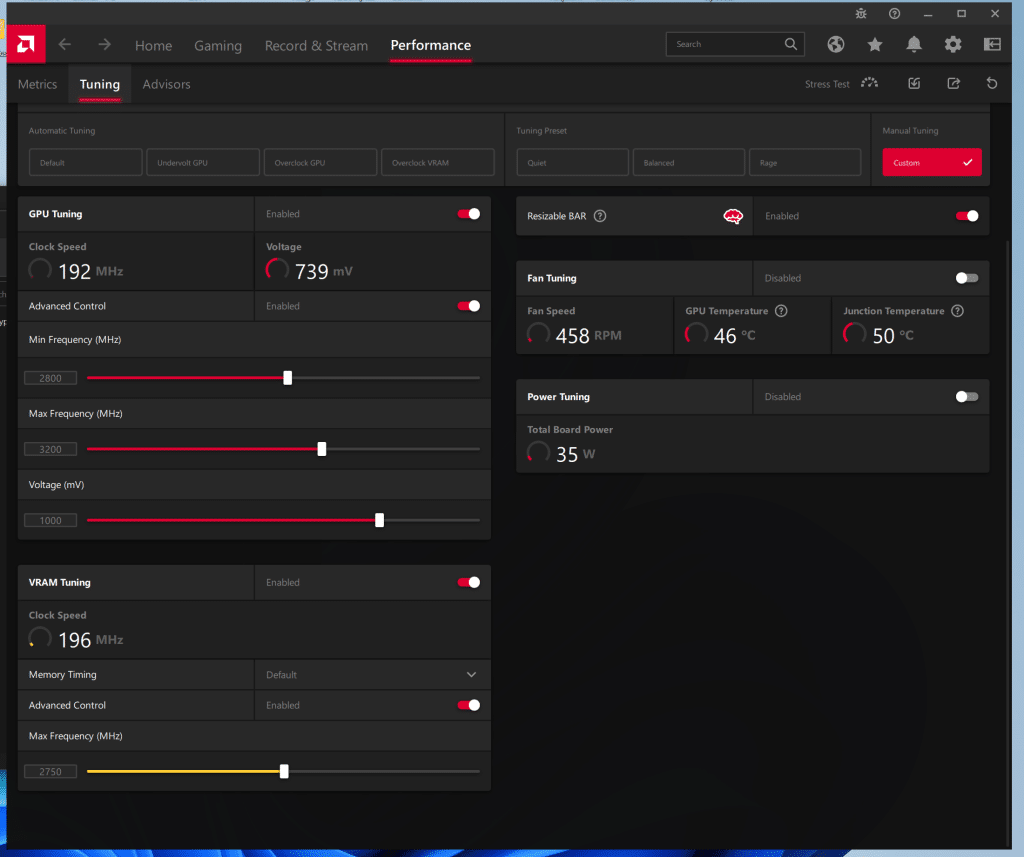
- The best overclocking settings for my RX 7900 XT are shown in the screenshot below. The difference with the above setting in performance is minimal, though.
To wrap up, the tiny dimensions of the RX 7900 XT and the average power consumption, along with the good performance and the fair price (MSRP at least), are the factors that will define its market career. I hope I find an RX 7900 XTX to perform a detailed power and overclocking analysis. I am primarily interested in the peak power readings and the temperatures.
Why default timings and not fast timings?
thanks, great write up and screenshots at the end of your settings were very helpful!