
In today’s article I will show you how to easily extract data from CapFrameX log files. This will save you time, since you won’t have to do it manually. Moreover, the more you type the more errors you will probably do, so it is better to do data extraction automatically.
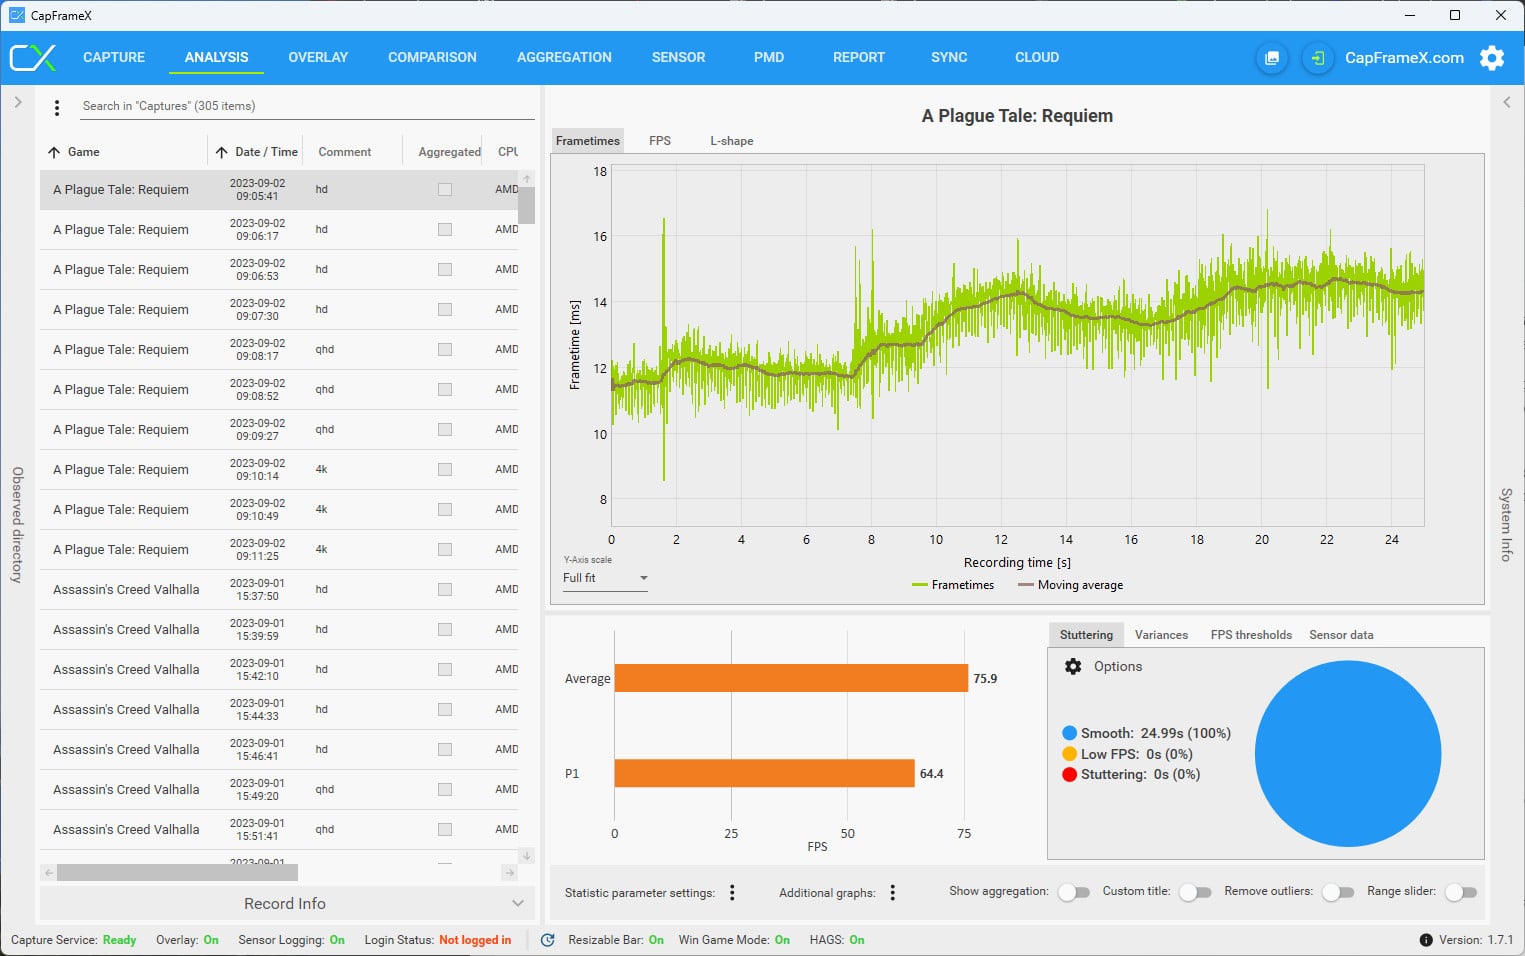
For those of you who live under a rock, CapFrameX is a Frametimes capture and analysis tool based on Intel’s PresentMon. It is one of the first apps to support our Powenetics v2 power analysis board and our favorite tool for capturing game FPS. The native Powenetics app also has FPS capturing capabilities, but the CapFrameX is at another level in this section.
Contrary to what most people think, the Python programming language is not new since its version was released in 1991. Python, among others, is good for task automation and data analysis, and in this article, I will exploit both. So far, the thing with GPU testing goes like this, I run a game and capture its FPS data through CapFrameX, which saves its log files in JSON format in a folder named “Captures” located here: “C:\Users\Your User Name\Documents\CapFrameX\Captures”
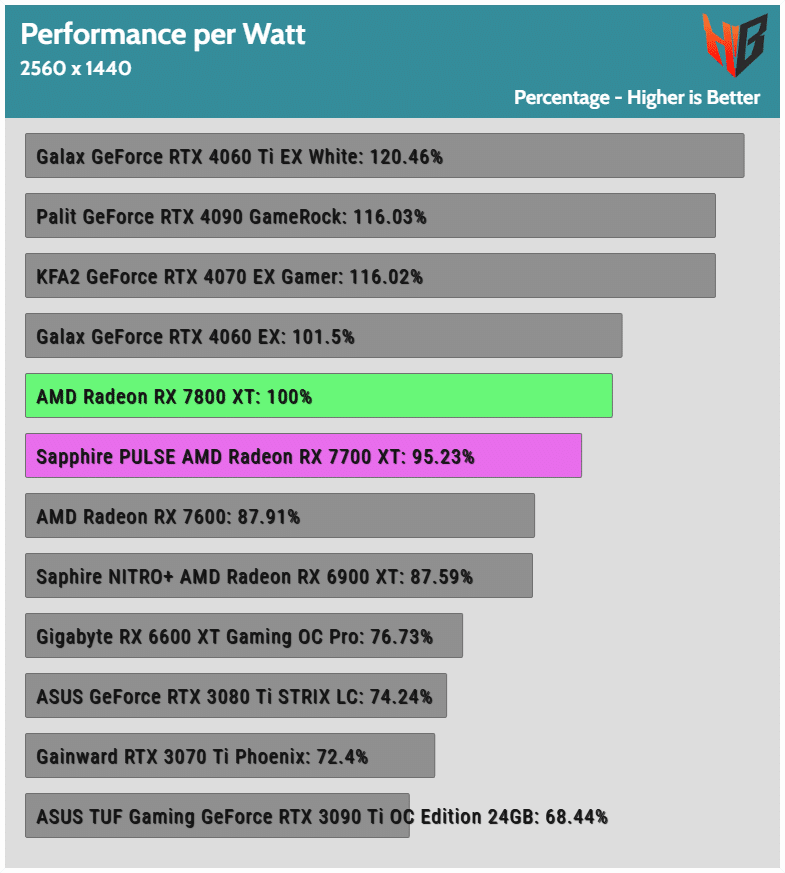
After I conduct all game benchmarks, a procedure that I need to automate else I will grow old benchmarking games, and have all data gathered in CapFrameX, I need to transfer somehow the data I need, that is average and 1% Low FPS, to several excel sheets where with a press of a button I create charts like the one below.
Since I don’t expect you to use the same Excel files as me, I will provide a generic way to extract data from all CapFrameX logs and send them to two Excel files, one containing Average frames and one the 1% Low ones.
I assume that you already know how to install Python on your system. If you don’t, make a Google search and come back here after you do it. If you are not experienced in Python, you should also check out Thonny, which is a Python IDE for beginners.
So, by now, you should have installed Python and already opened Thonny. You should also have some JSON files in the CapFrameX’s “Capture” folder.
Let’s first import the required modules:
# Import Module
import os, json
import pandas as pd
from statistics import mean
from openpyxl import load_workbook
import numpy as np
We need them to let Python know where to find the “Capture” folder. This is done with the following code.
# this finds our json files
path_to_json = ‘C:/Users/ARIS/Documents/CapFrameX/Captures’
json_files = [pos_json for pos_json in os.listdir(path_to_json) if pos_json.endswith(‘.json’)]
All data from the JSON files needs to pass to a Pandas DataFrame, through the code provided below. To keep it simple, a Pandas DataFrame is a 2-dimensional data structure, like a 2-dimensional array or a table with rows and columns. Pandas is a powerful, highly flexible, and easy-to-use open-source data analysis and manipulation tool. The things you can do with this module are far too many!
# here I define my pandas Dataframe with the columns I want to get from the json
jsons_data = pd.DataFrame(columns=[‘GameName’, ‘Resolution’,’AVG Frames’, ‘1% Low’])
I need now to read all JSON files that the Captures folder contains and include them in the Pandas DataFrame. Note that I use indentation to inform Python about what code needs to run in a loop. Python doesn’t use brackets like other popular programming languages because its maker claims that indented code seems neat and tidy. Indentation forces the user to give spaces and is used in replacement of brackets because indentation makes code maintainable. For inherent readability of the code. I partially agree, but there are times that I miss brackets so much. When you capture game FPS, I feel the comment section with the resolution that I use: HD, QHD, or 4K. This is mandatory, or else you cannot distinguish the results!
# we need both the json and an index number so use enumerate()
for index, js in enumerate(json_files):
with open(os.path.join(path_to_json, js)) as json_file:
json_text = json.load(json_file)# here you need to know the layout of your json and each json has to have
# the same structure (obviously not the structure I have here)
GameName = json_text[‘Info’][‘GameName’].lower()
Resolution = json_text[‘Info’][‘Comment’].lower()
MsBetweenPresents = json_text[‘Runs’][0][‘CaptureData’][‘MsBetweenPresents’]
AVG_Frames = round (1000 / (mean(MsBetweenPresents)), 1)
p = round (1000 / np.percentile(MsBetweenPresents, 99), 1)
jsons_data.loc[index] = [GameName, Resolution, AVG_Frames, p]
Through the following code, I create two new DataFrames, one containing the Average FPS and one the 1% Low FPS data. The “groupby” command allows me to group the results according to the Game’s name and the resolution that I used to run the benchmark. I also round the results to the second digit with the “round(2)” command.
#Summarize data
df = jsons_data.groupby([‘GameName’, ‘Resolution’]).mean()[‘AVG Frames’].round(2)
dg = jsons_data.groupby([‘GameName’, ‘Resolution’]).mean()[‘1% Low’].round(2)
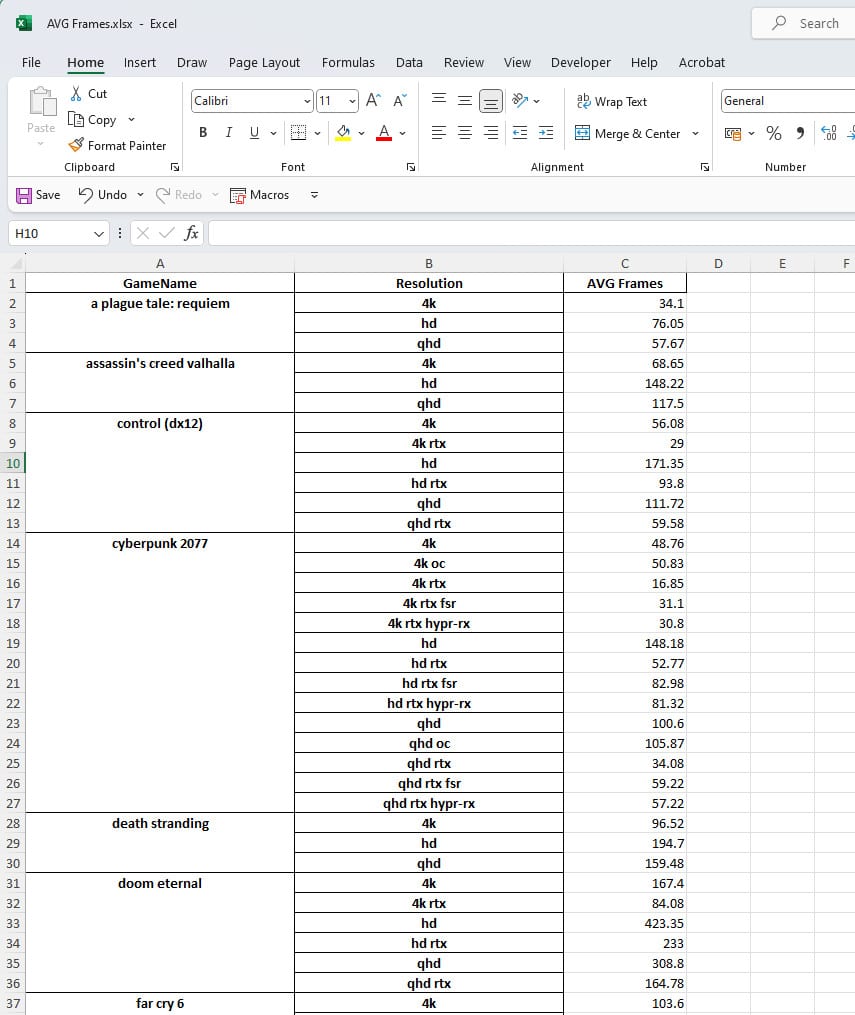
Time to save the results to two Excel files located in the same folder with the Python script.
df.to_excel(‘AVG Frames.xlsx’)
dg.to_excel(‘1% Low.xlsx’)
That was all, guys! I could have 300-500 JSON files, and with the press of a button, all the results I need are gathered from them and transferred to the corresponding excel files, so I can easily use them and make some nice graphs.
Here is the complete script:
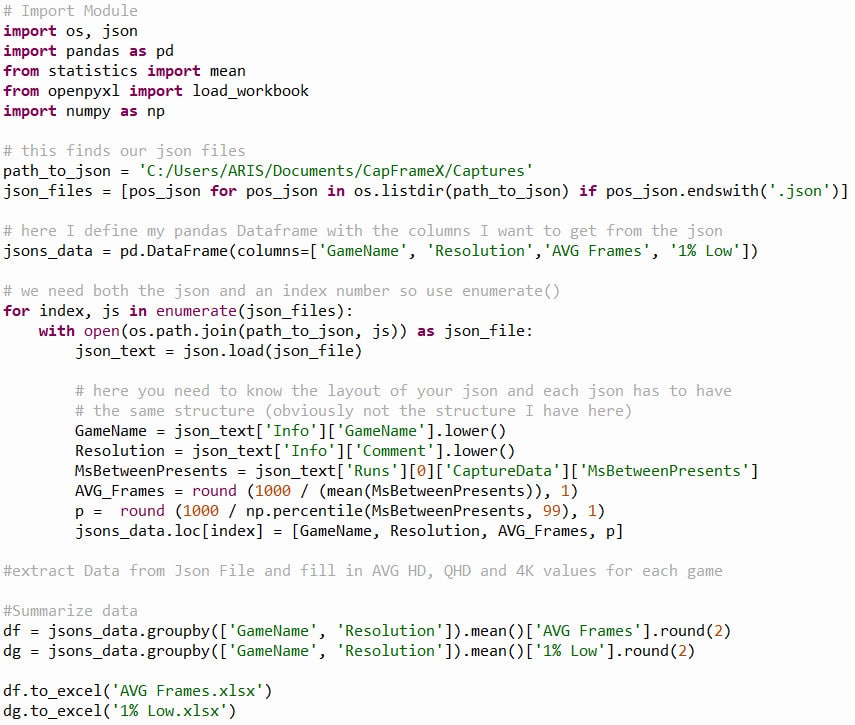
It was easy, wasn’t it? Leave a comment if you liked today’s article to encourage me to make more like this.