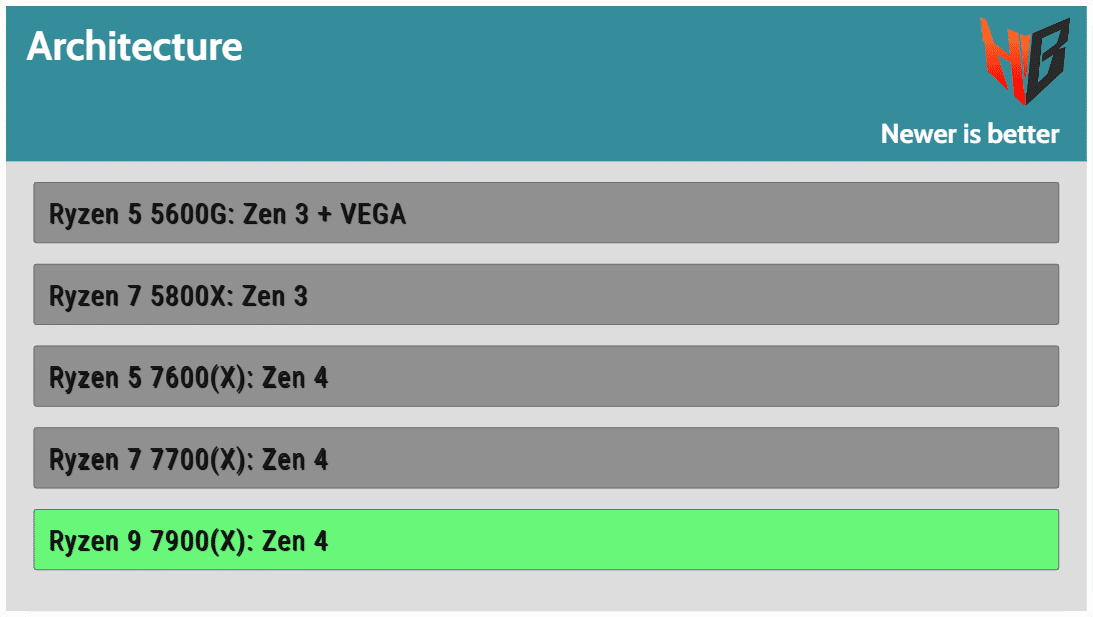
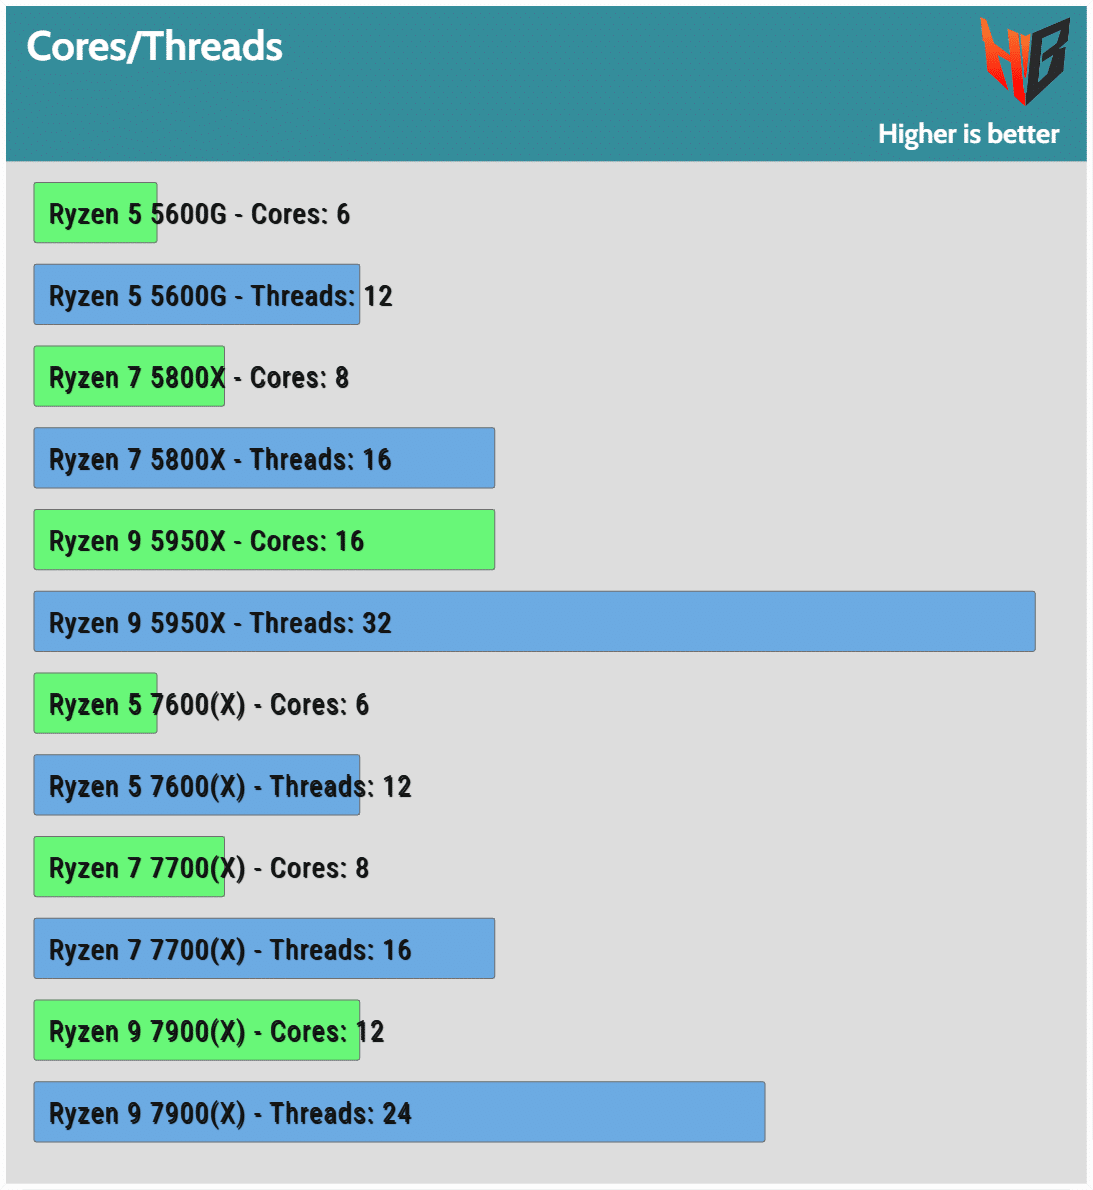
The AMD Ryzen 9 7900 is a low energy consumption beast, with 12 cores and 24 threads in total. Its only differences with the 7900x are in operating frequencies and in thermal design power (TDP). Another notable advantage over the 7900x, is that the 7900 doesn’t require strong cooling.
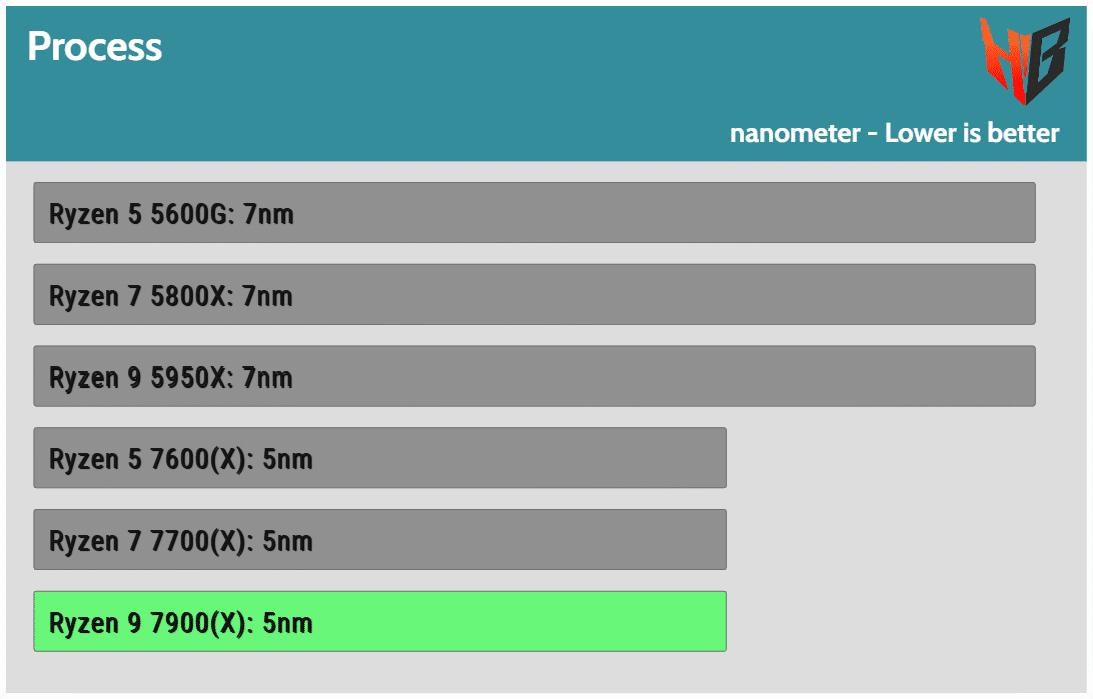
The non-X AMD Raphael CPUs (7000 series) have notably lower TDPs, leading to lower operating temperatures and increased efficiency in some cases. The differences between the Ryzen 9 7900x and the 7900 are in the operating frequencies and thermal design power, which is 170W for the first and only 65W for the latter. The number of cores, threads, and L2 and L3 cache is the same, making me wonder about the performance loss on the 7900, given the 105W lower TDP. The Ryzen 9 7900 addresses users who don’t want to use a super-strong cooling solution to achieve best performance but are happy with the excellent, for a stock cooler, AMD Wraith Prism, which features RGB lighting. In the same family, besides the Ryzen 9 7900, AMD has also included the Ryzen 7 7700 and the Ryzen 5 7600 processors.
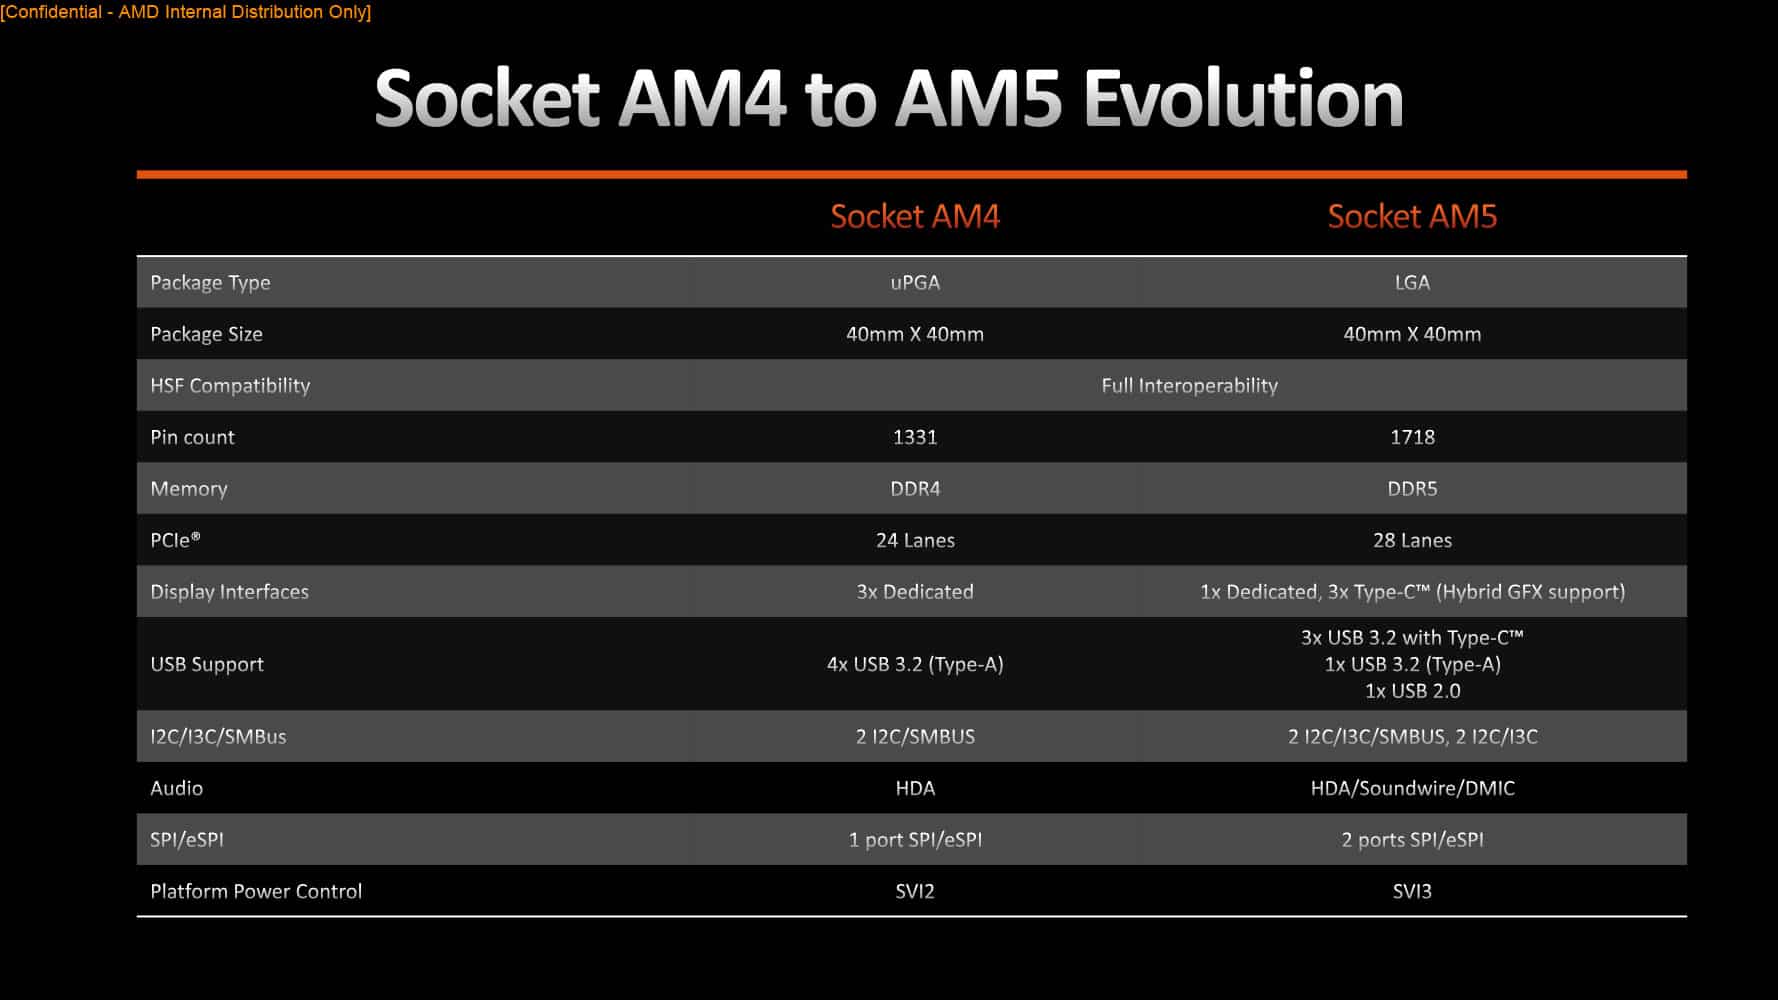
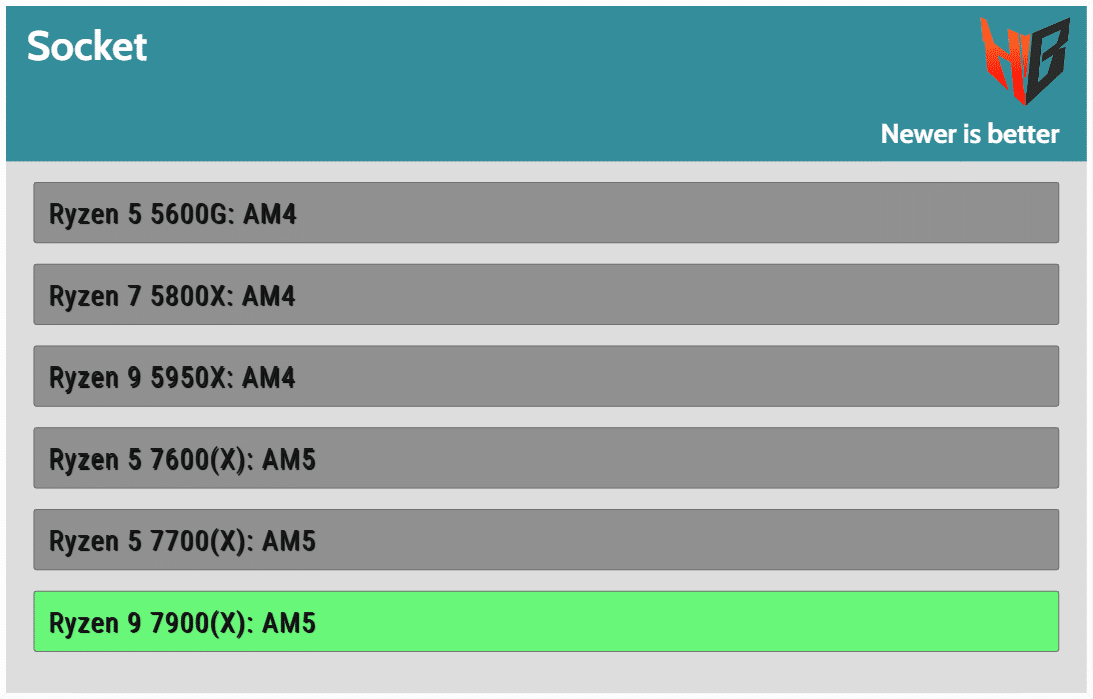
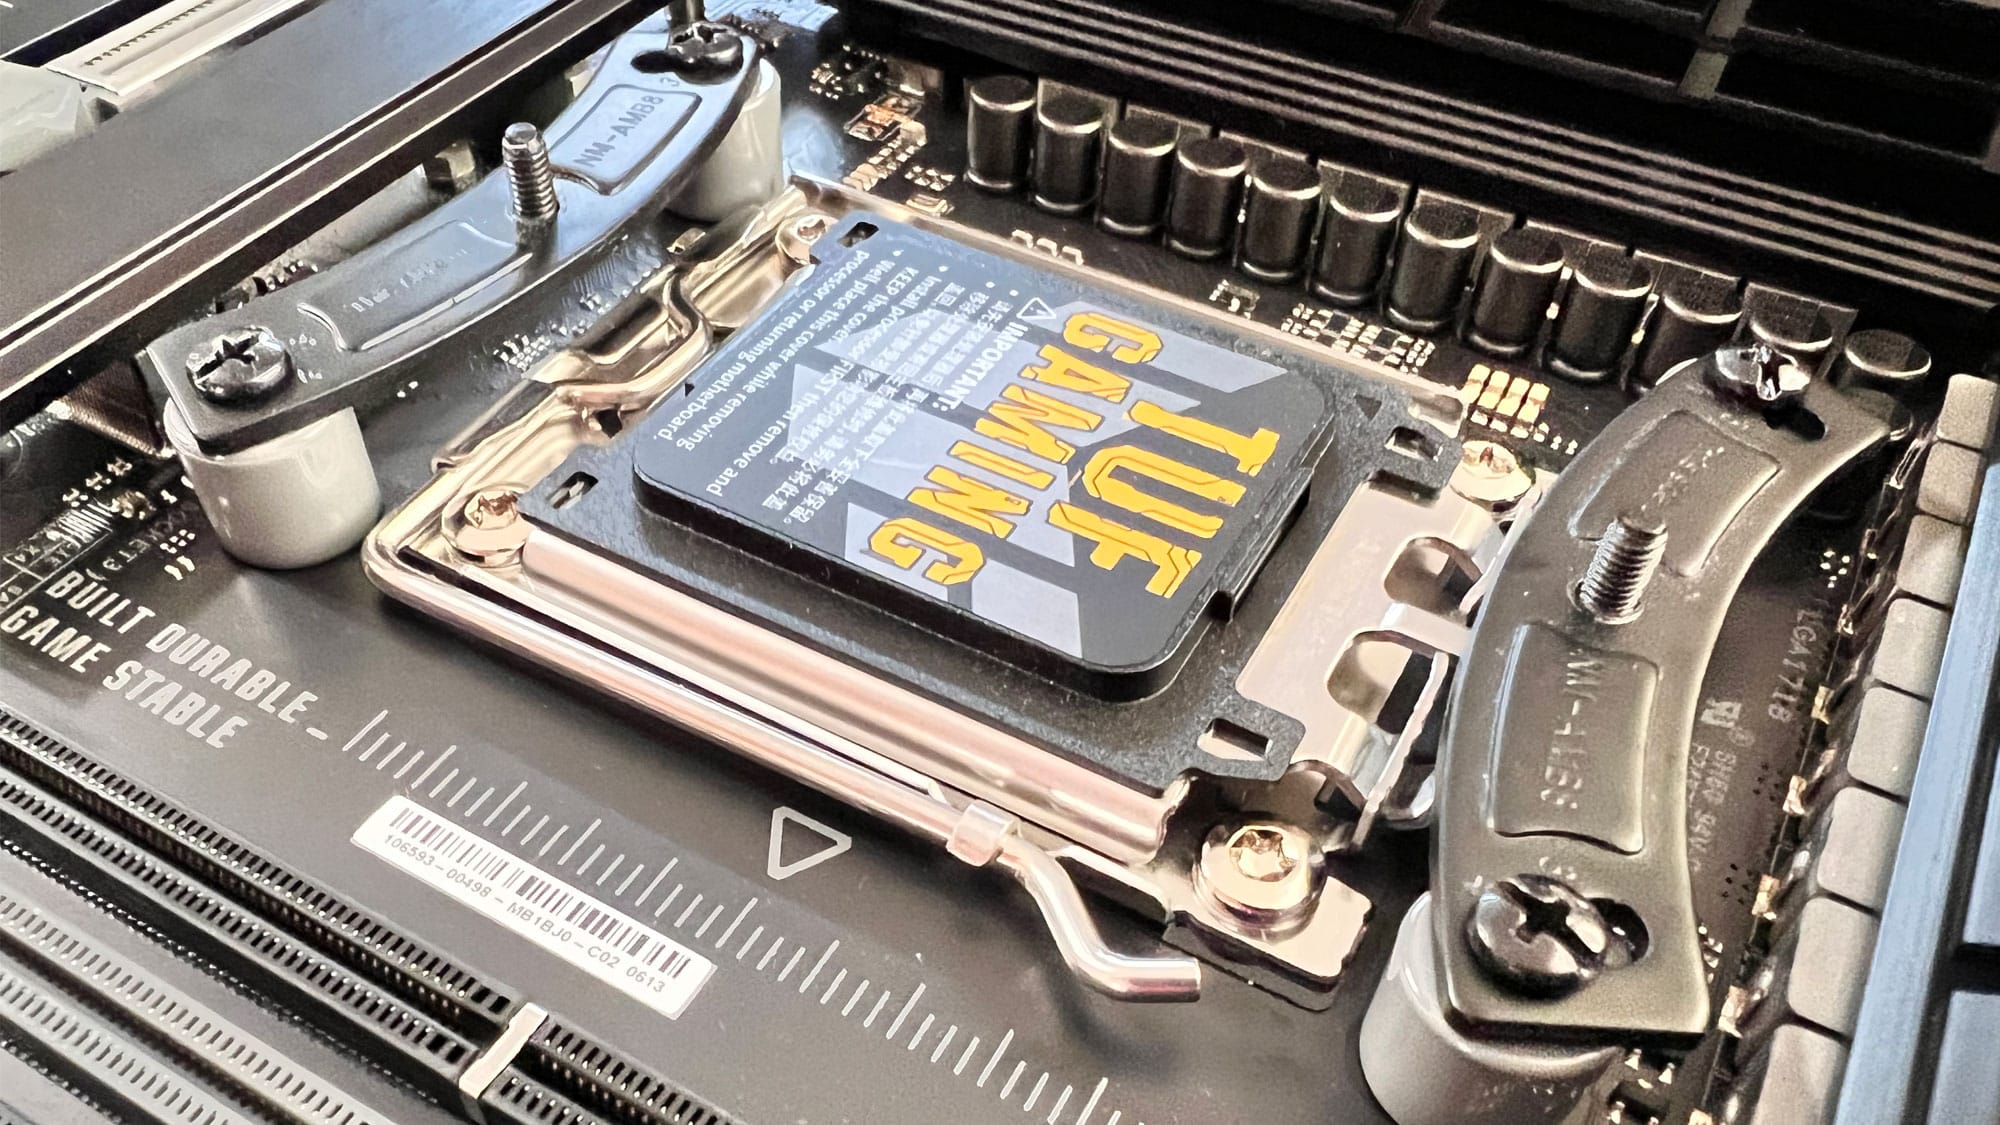
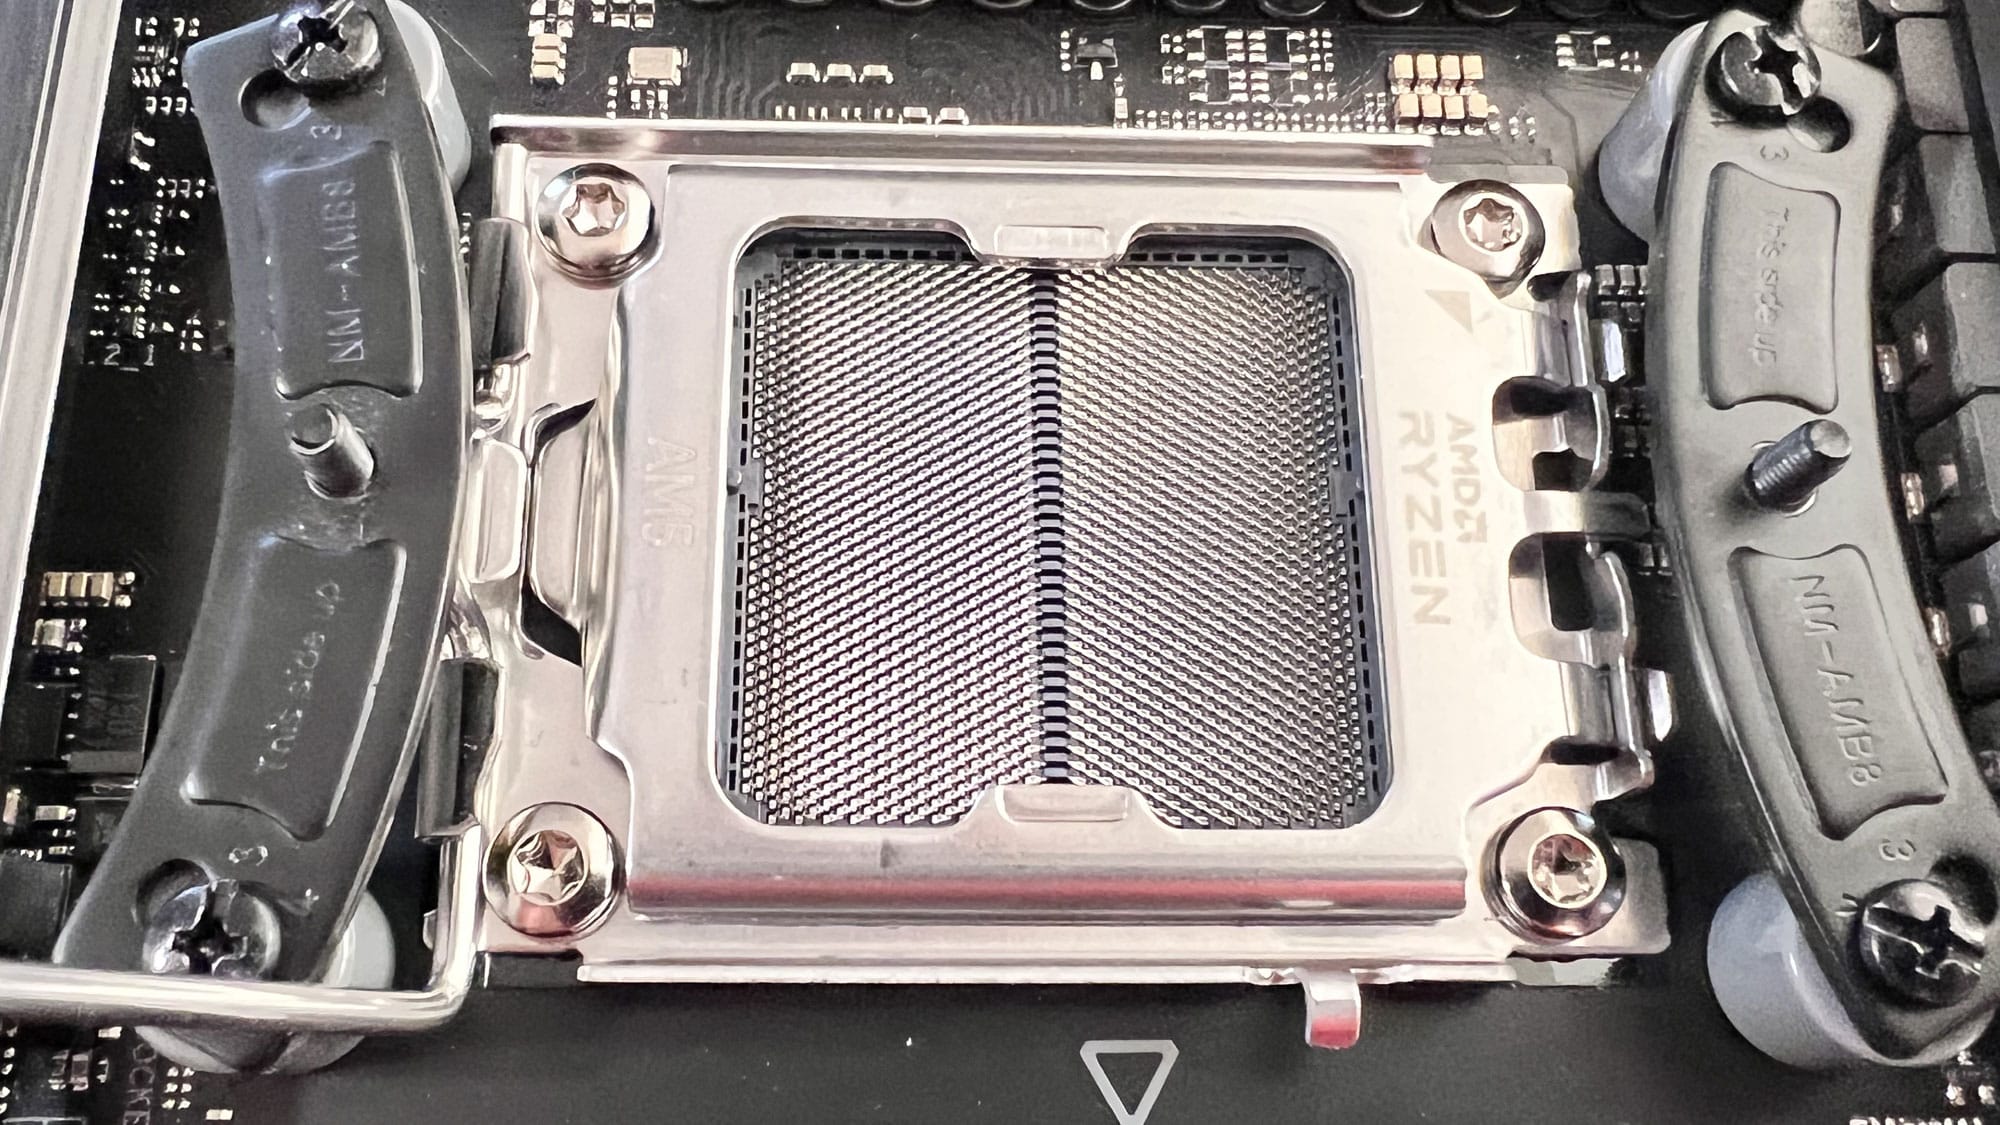
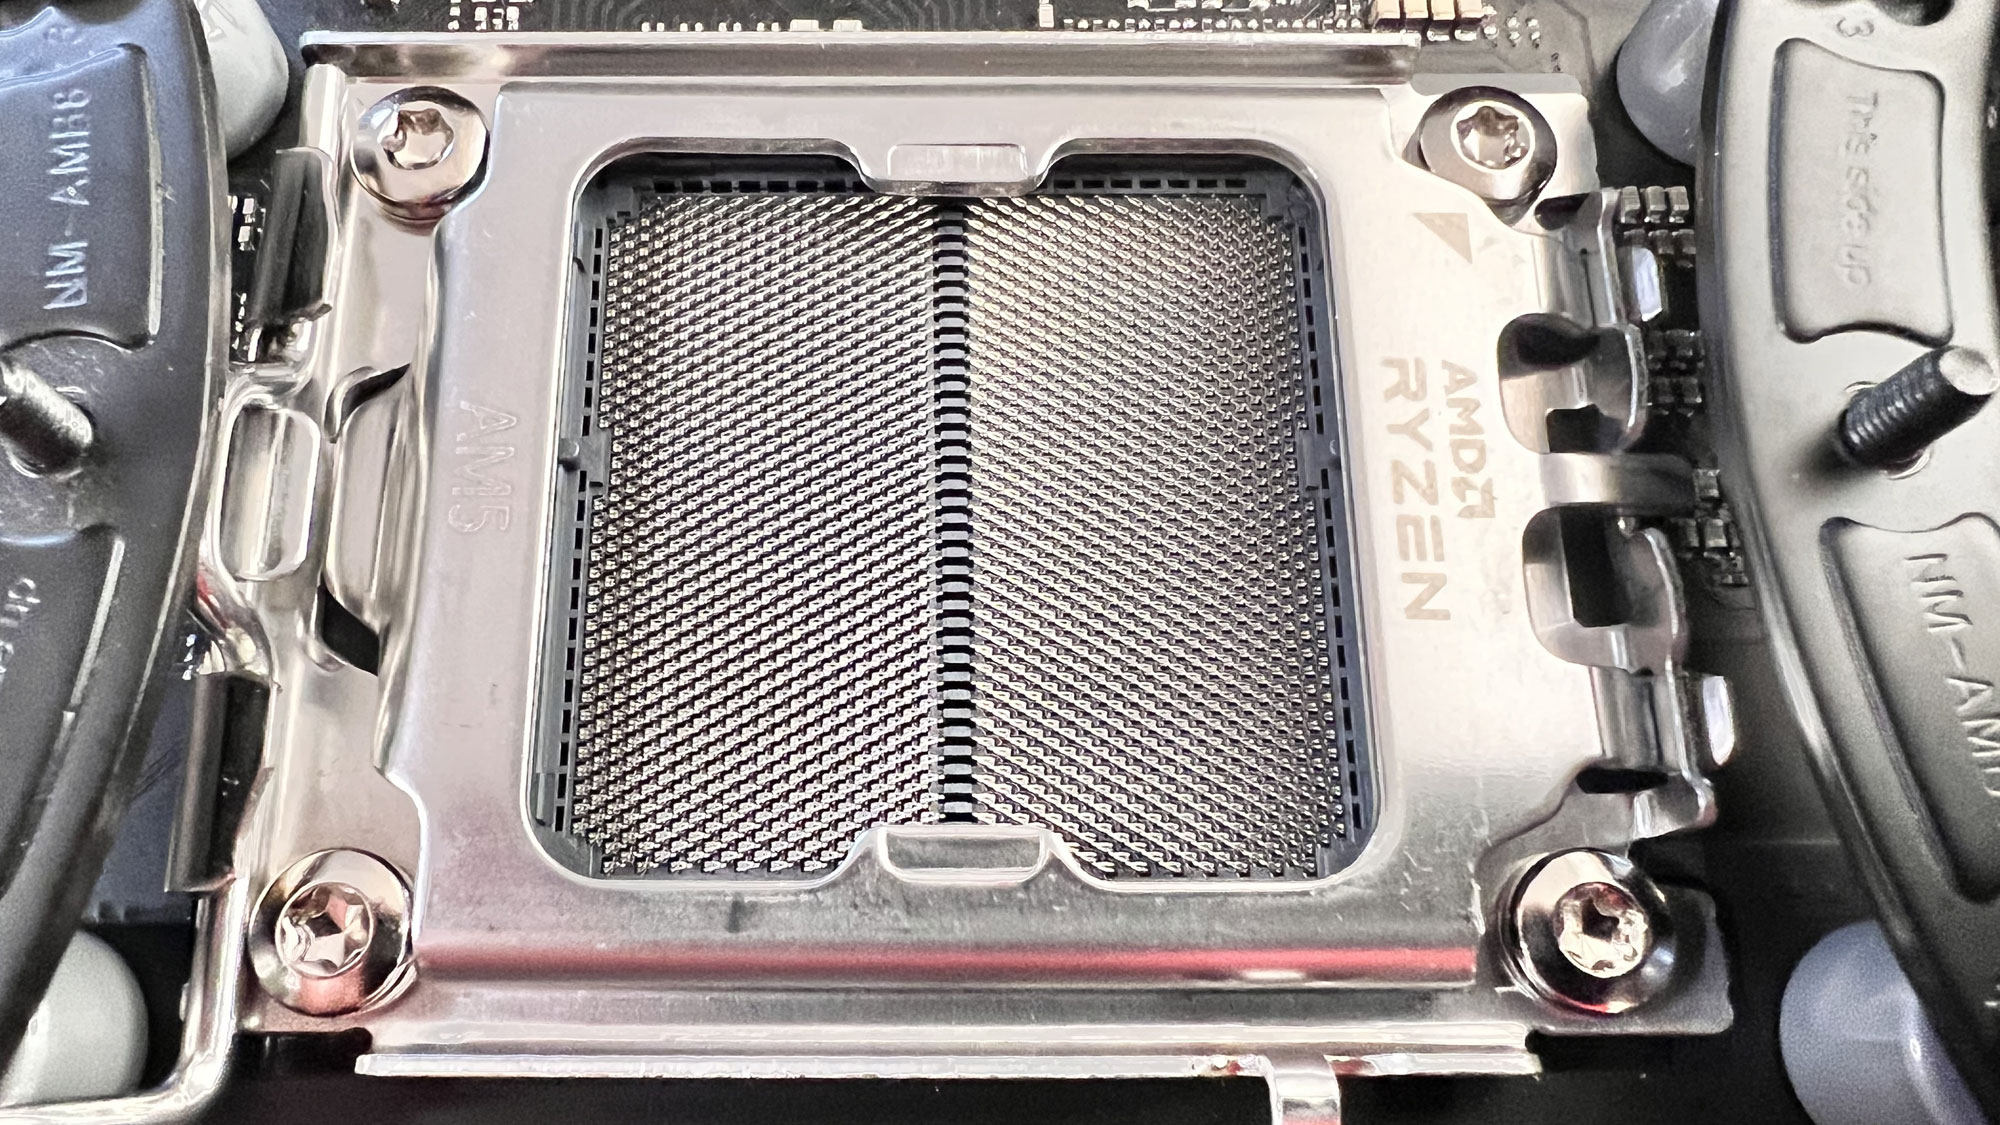
I have extensively covered the new AMD platform and chipsets in the Ryzen 7900x review, so if you want to learn more details, you should go and check it out. I will leave a scheme (below) pointing out the major differences between the AM4 and the AM5 sockets.
Specifications
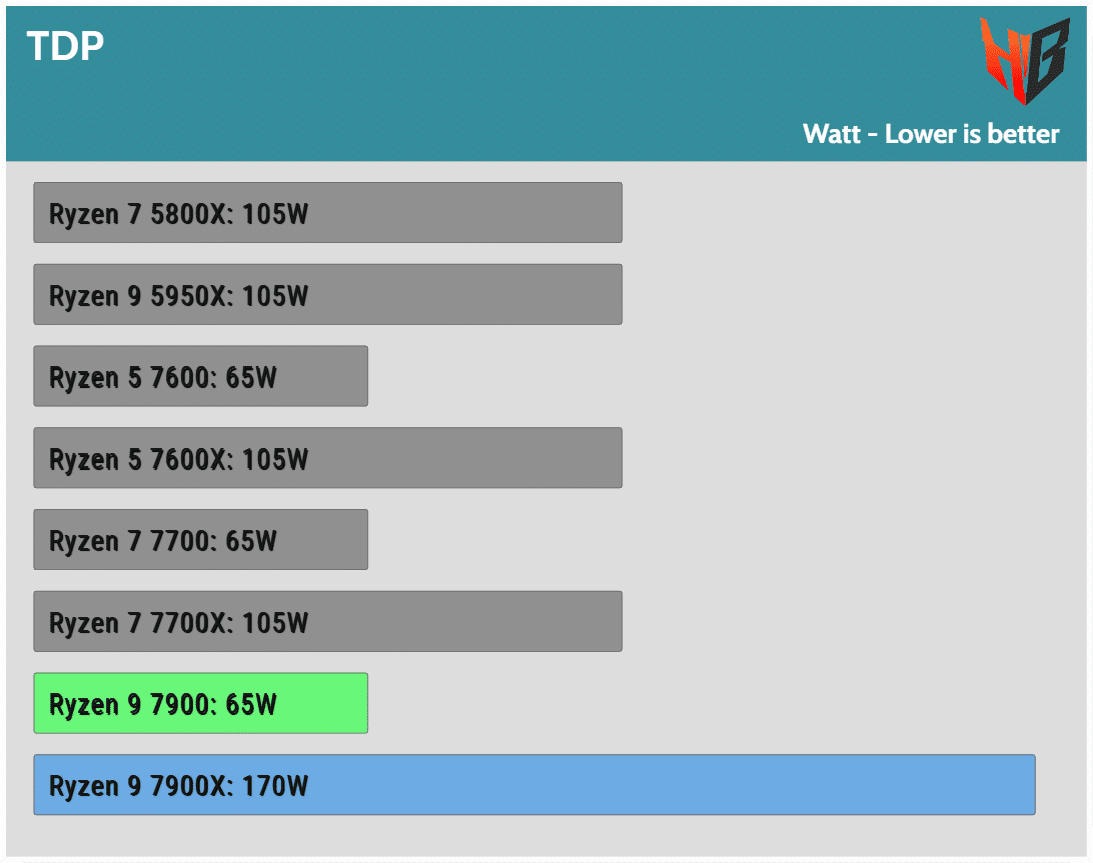
The TDP difference between the 7900x and the 7900 CPUs is vast!
Test System
| Test System Specs | ||||
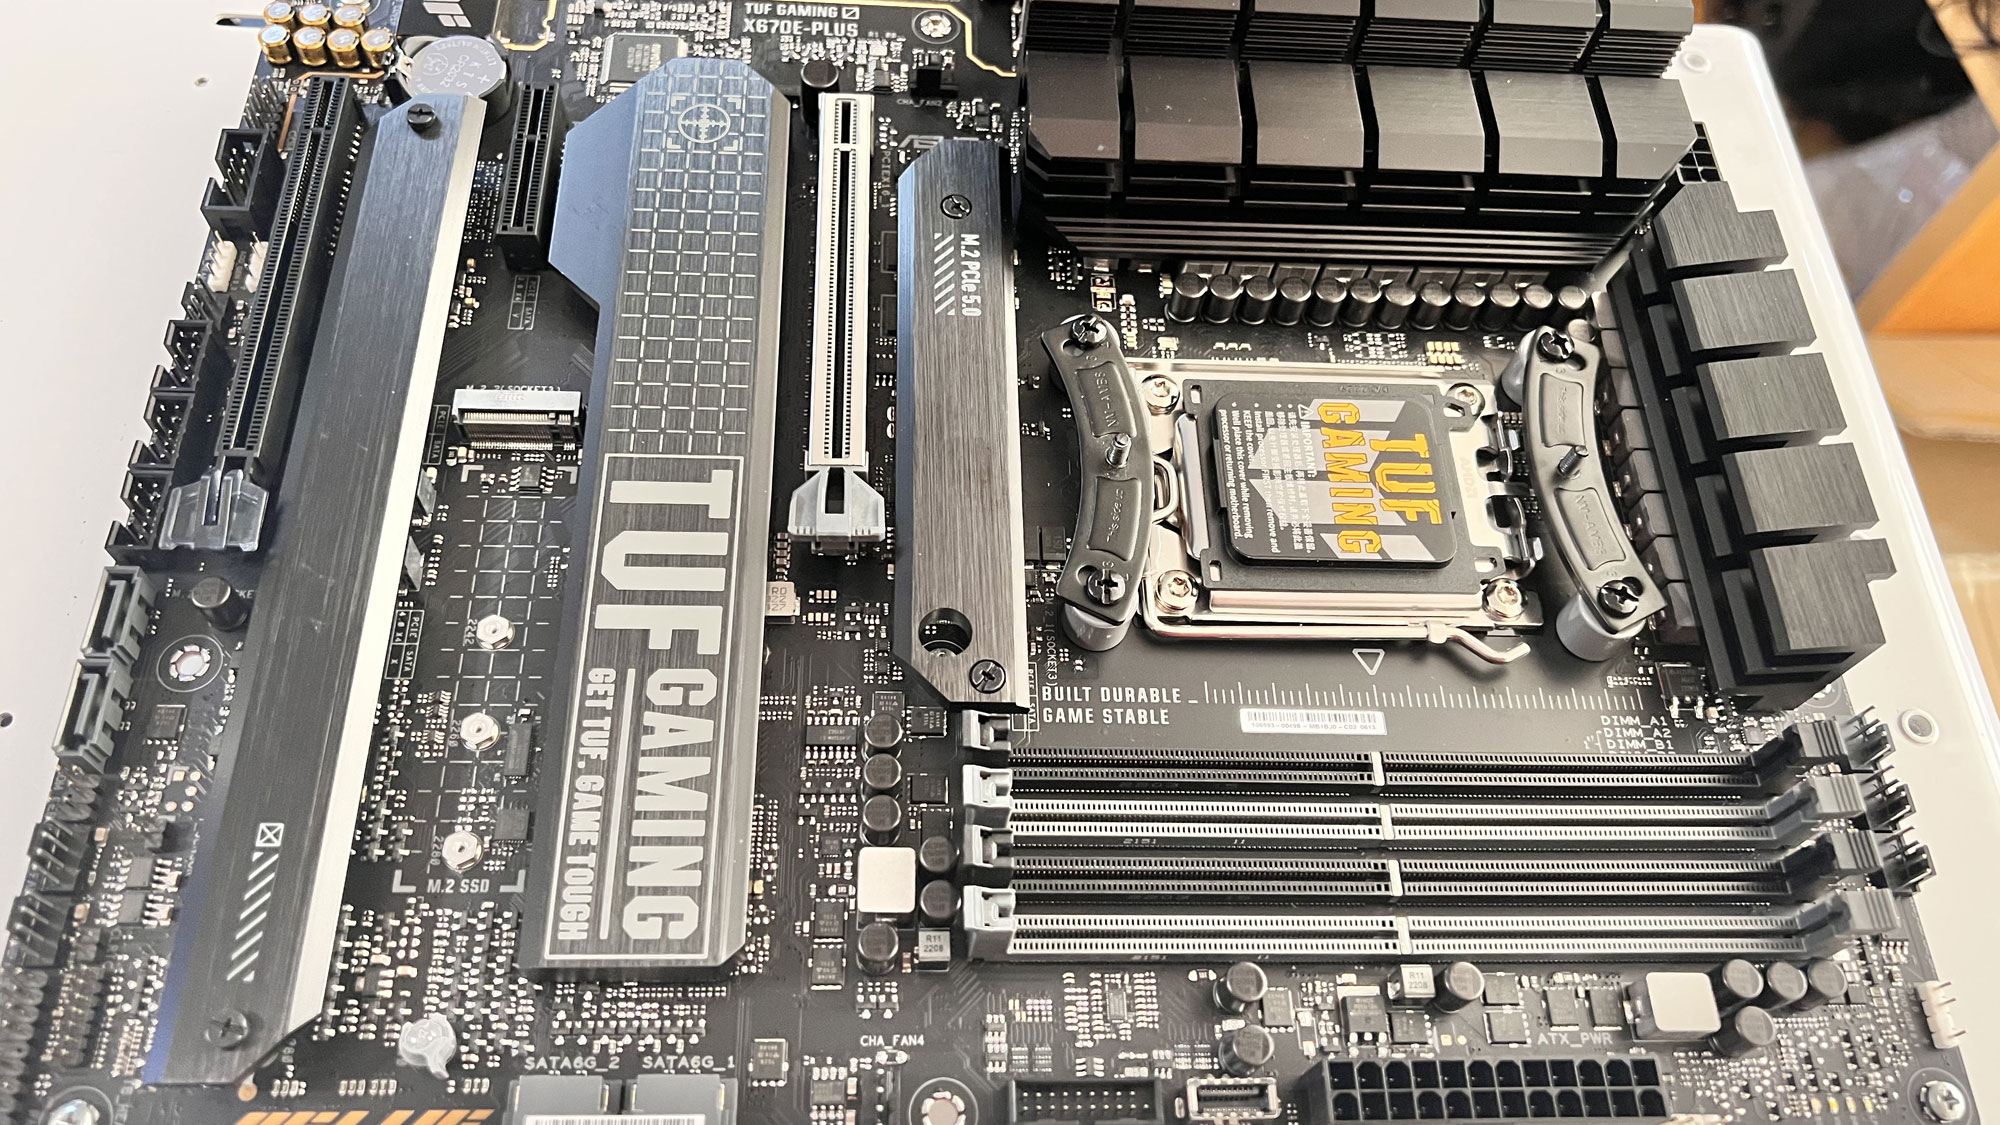
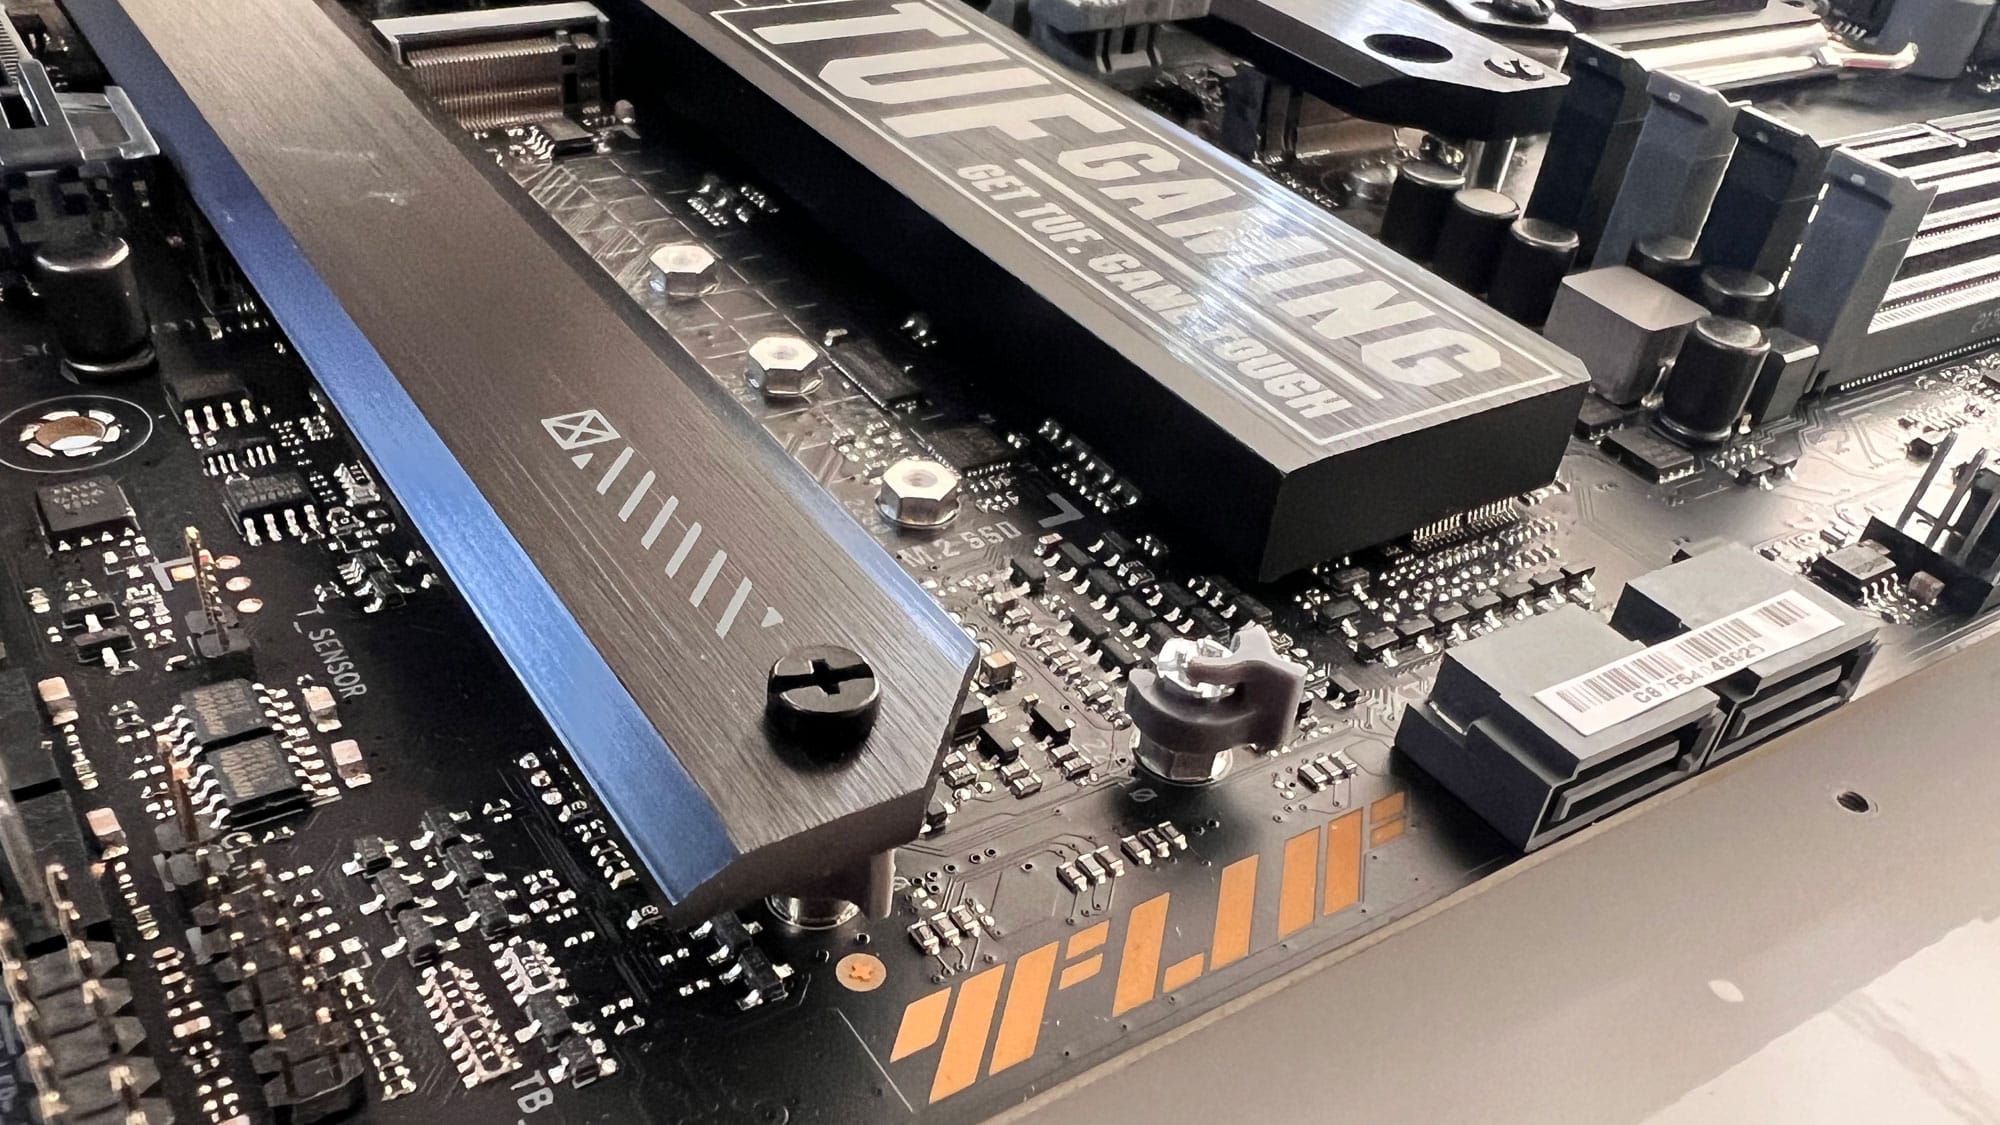
| Mainboard | ASUS TUF Gaming X670E-PLUS Bios Version 0821 (11/25/2022) |
|||
| CPU | AMD Ryzen 9 7900x (PBO Auto) |
|||
| GPU | AMD Radeon RX 6900XT | |||
| NVMe | XPG GAMMIX S50 Lite 1TB | |||
| RAM | XPG Caster (2 x 16GB) 6400MHz | |||
| Power Supply | Seasonic Vertex 1200W (Cybenetics Platinum) |
|||
| CPU Cooler | NH-D15S chromax.black | |||
| Case | DimasTech Bench | |||
| Ambient Temperature | 21°C ±3°C | |||
| Drivers | AMD: Adrenaline 22.20.42 | |||

This is the new test system for AMD processors. Besides the apparent mainboard change, I have also replaced the Corsair DDR5 5200 with faster XPG RAM. I did so because it was high time for faster RAM. This means that the results obtained with the slower Corsair RAM won’t be fully compatible with the ones I will get with the faster XPG RAM. I am totally aware of this, but in time I will make sure only to include results with the same RAM used.
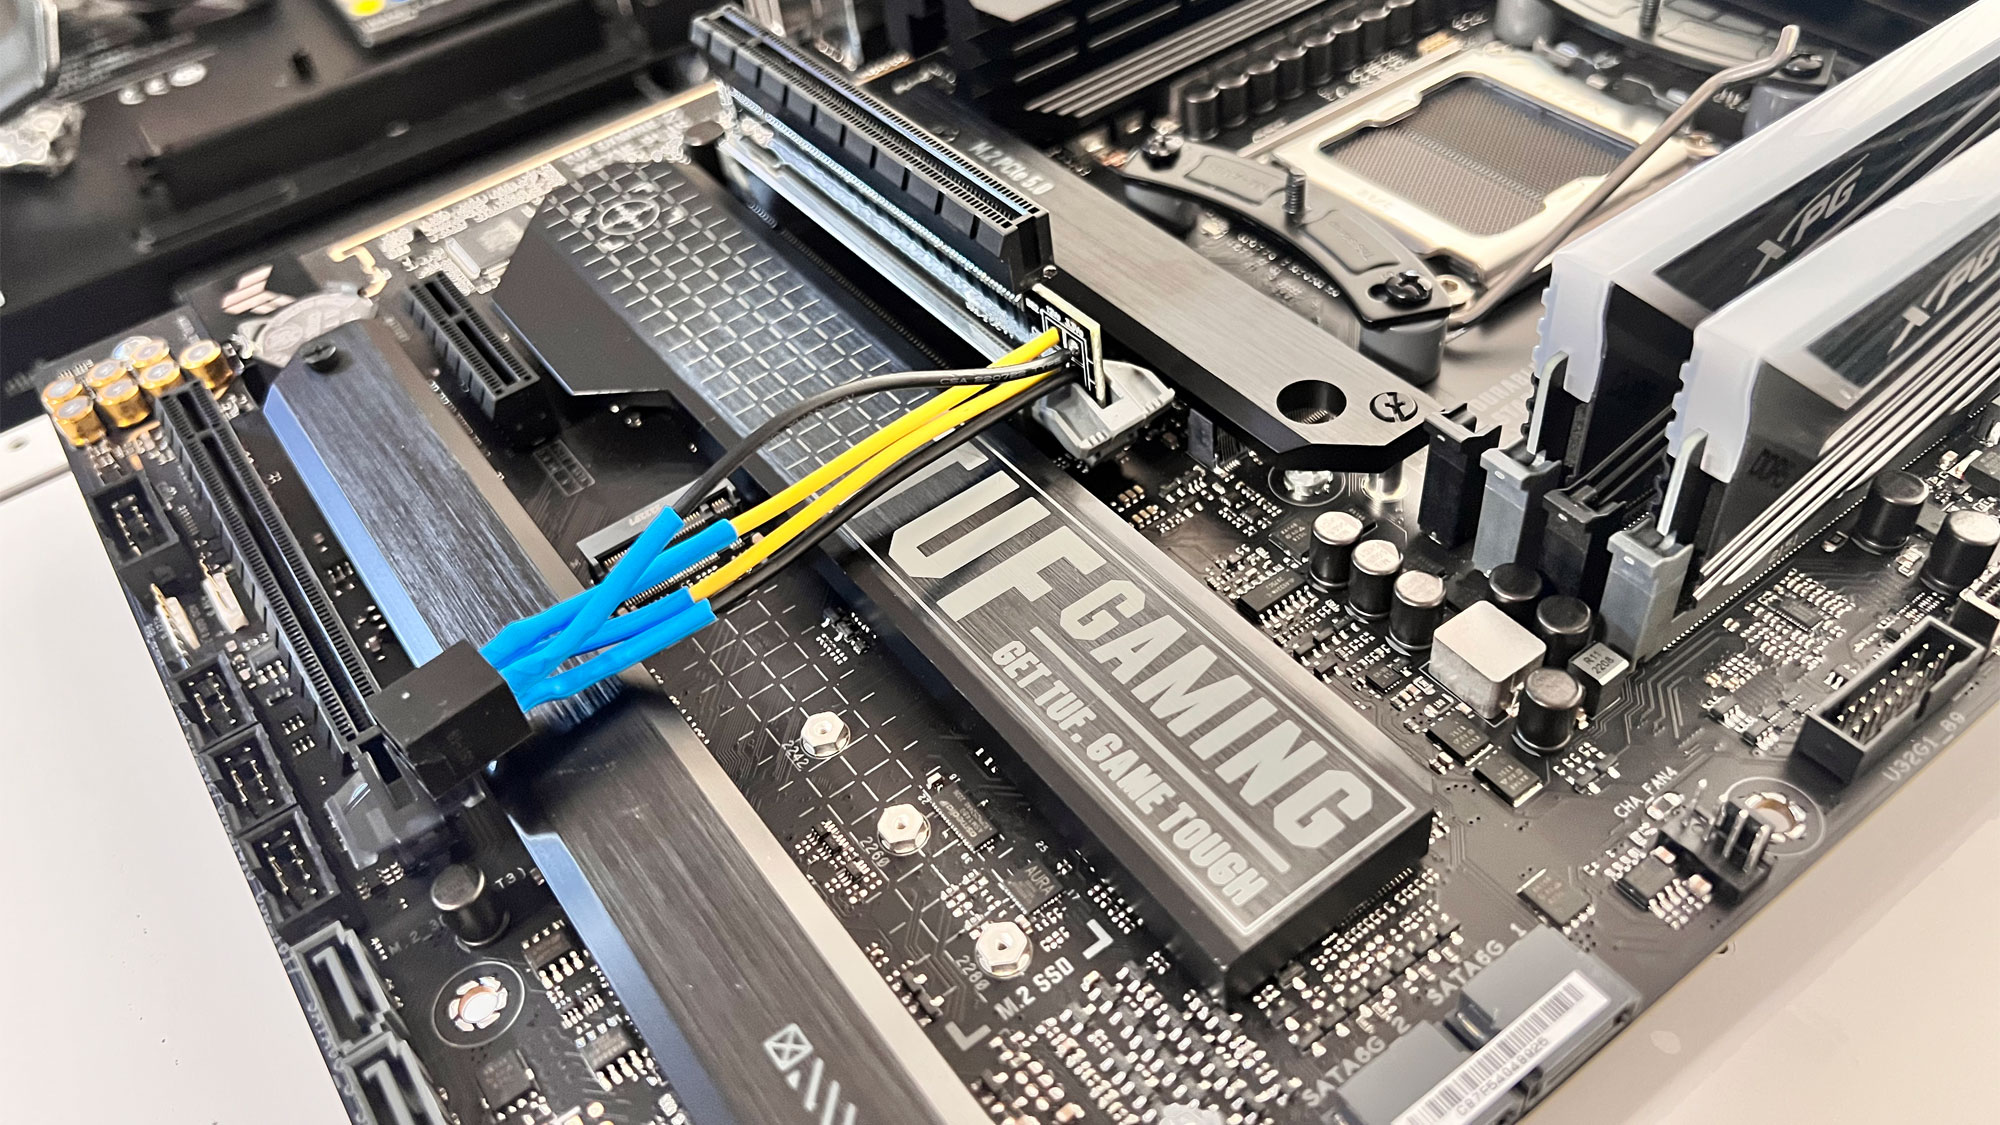
I had to modify the PCIe extension board of the Powenetics system because the PCIe slot’s lock mechanism was in the way.
Test Results
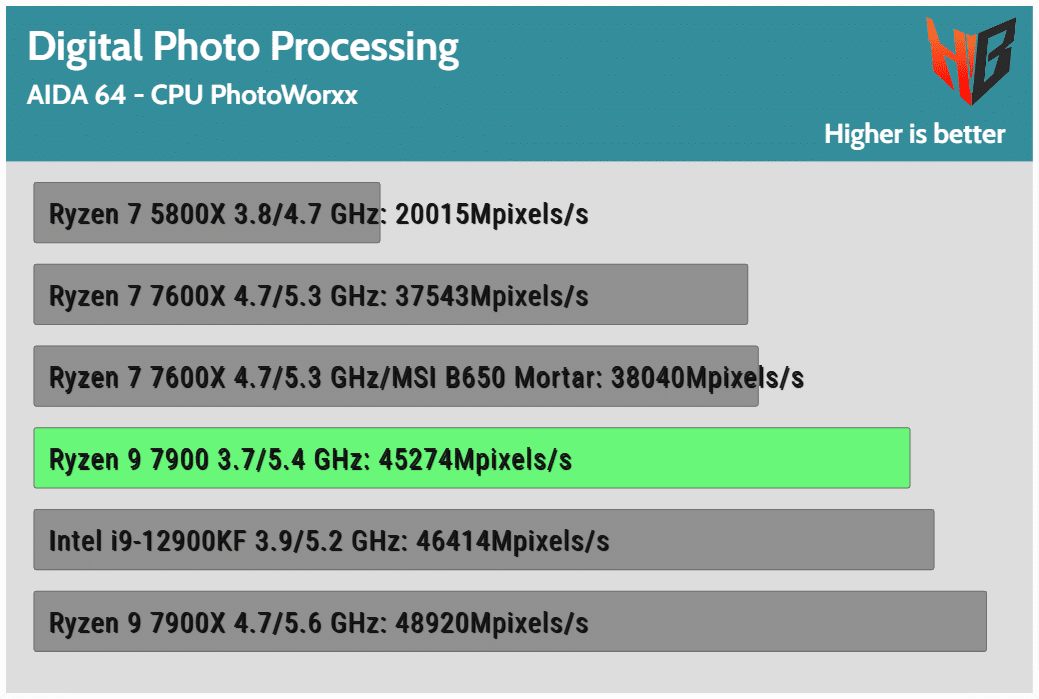
Synthetic Benchmarks
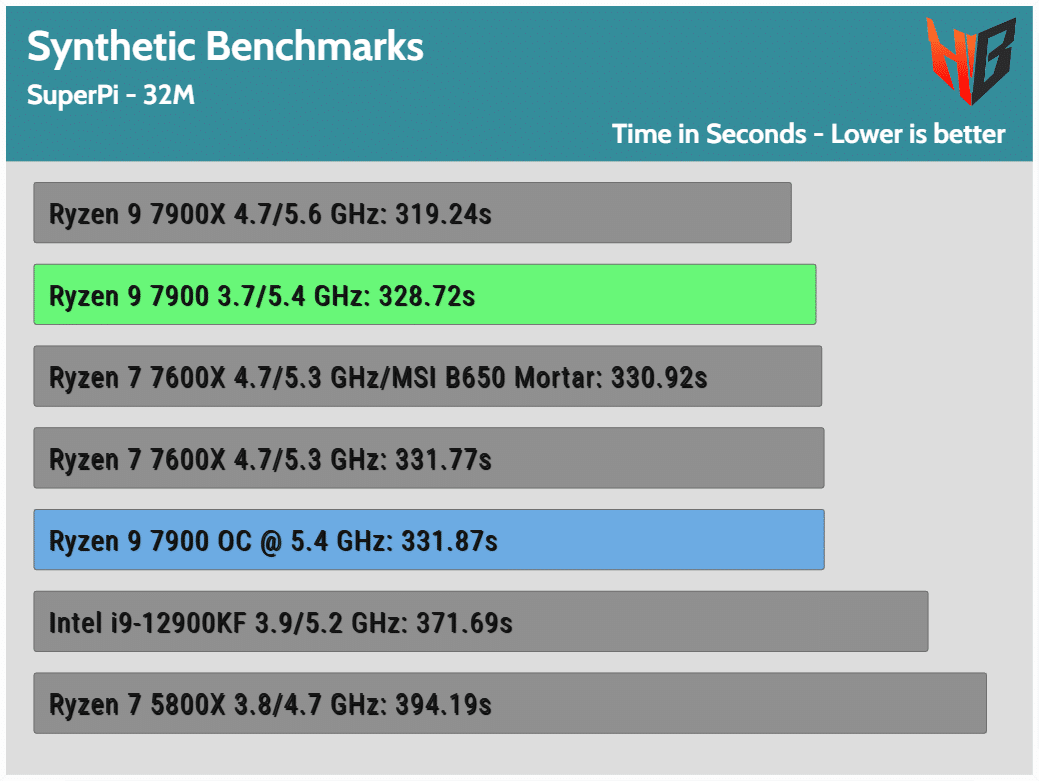

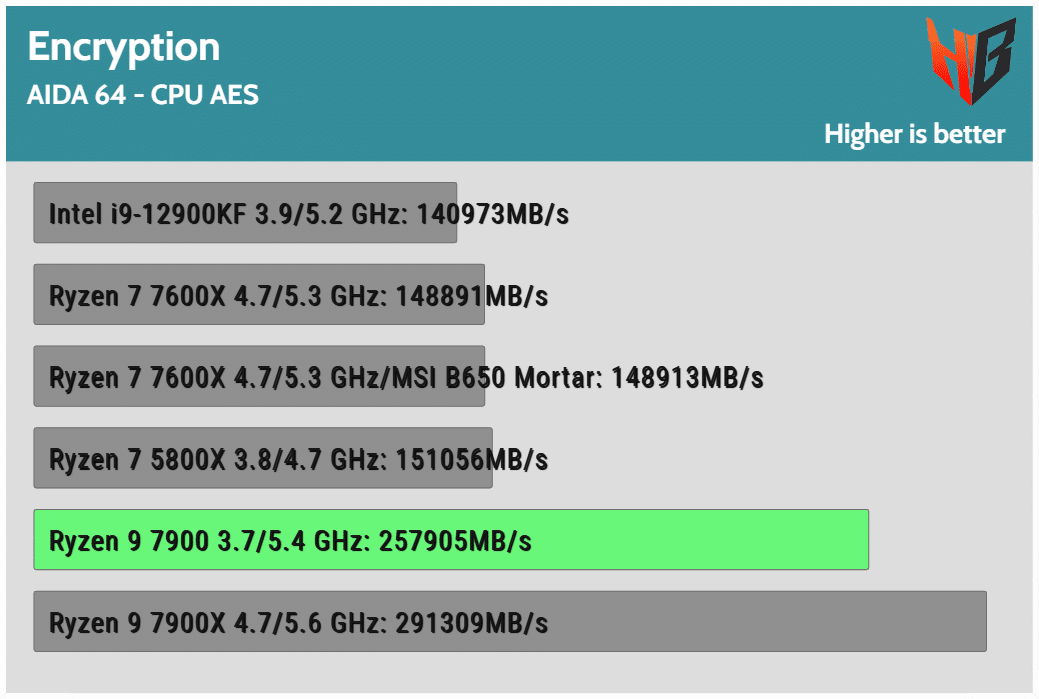
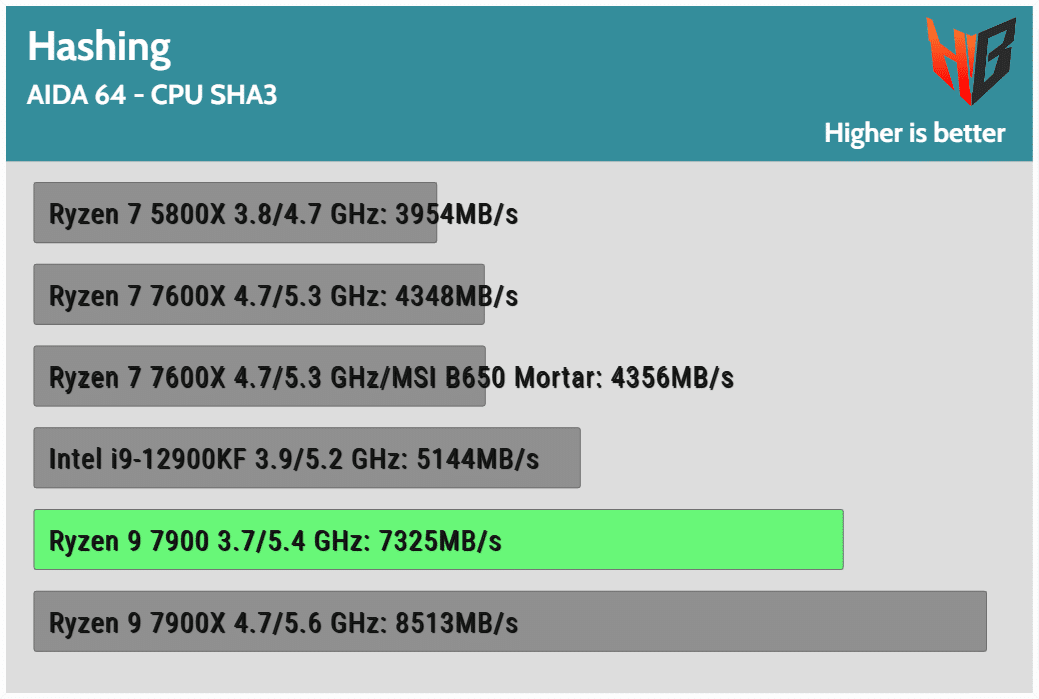
AIDA 64 CPU Benchmarks, Digital Photo Processing, Encryption & Hashing
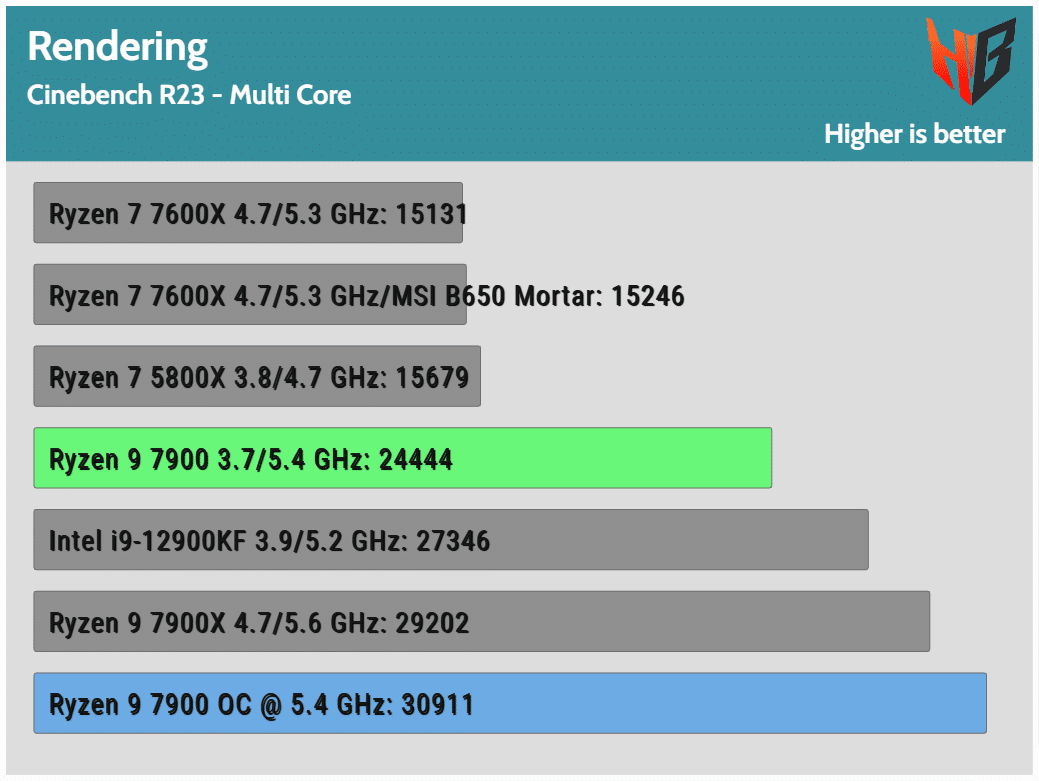
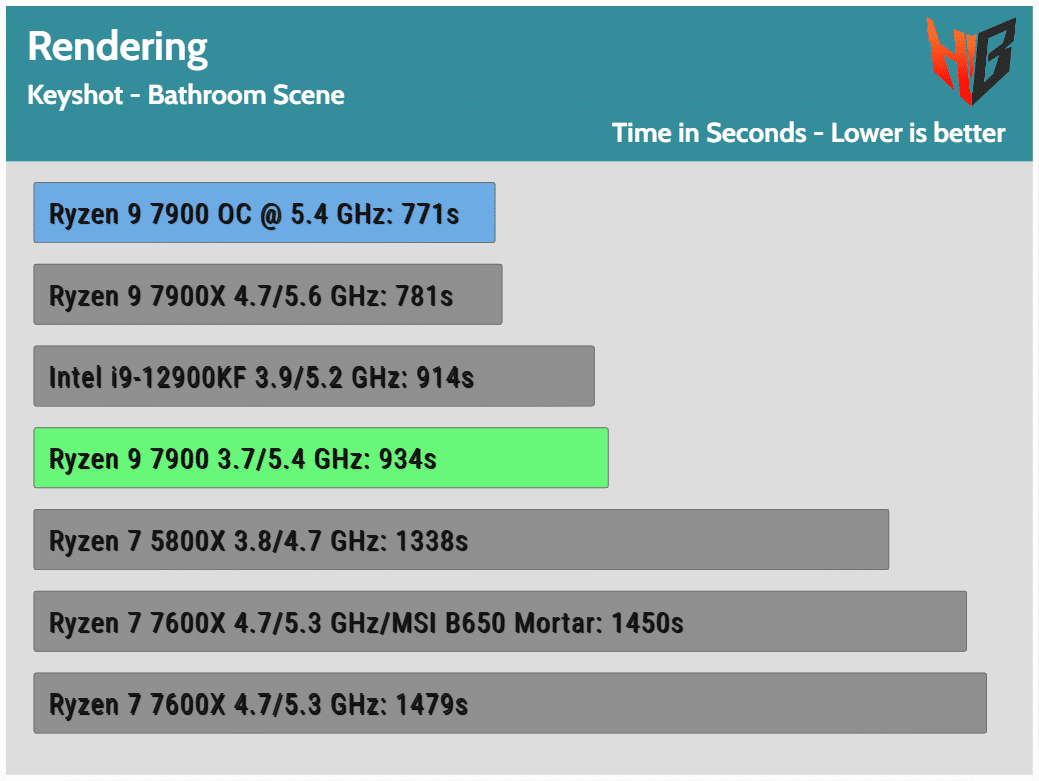
Rendering
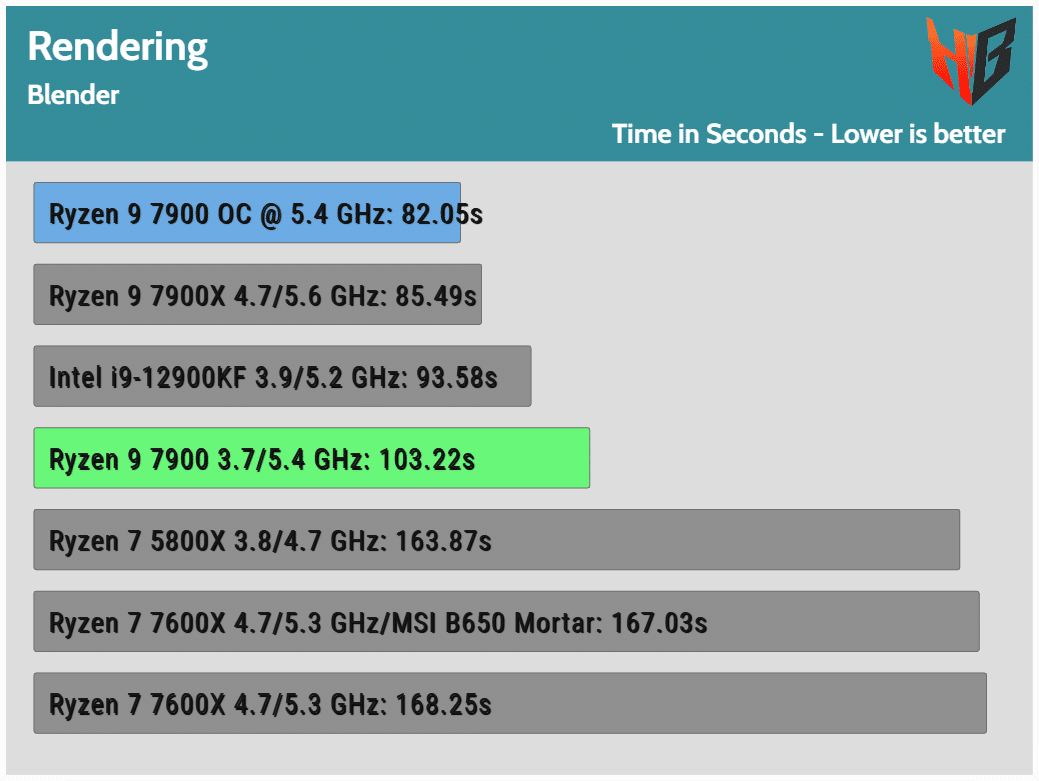
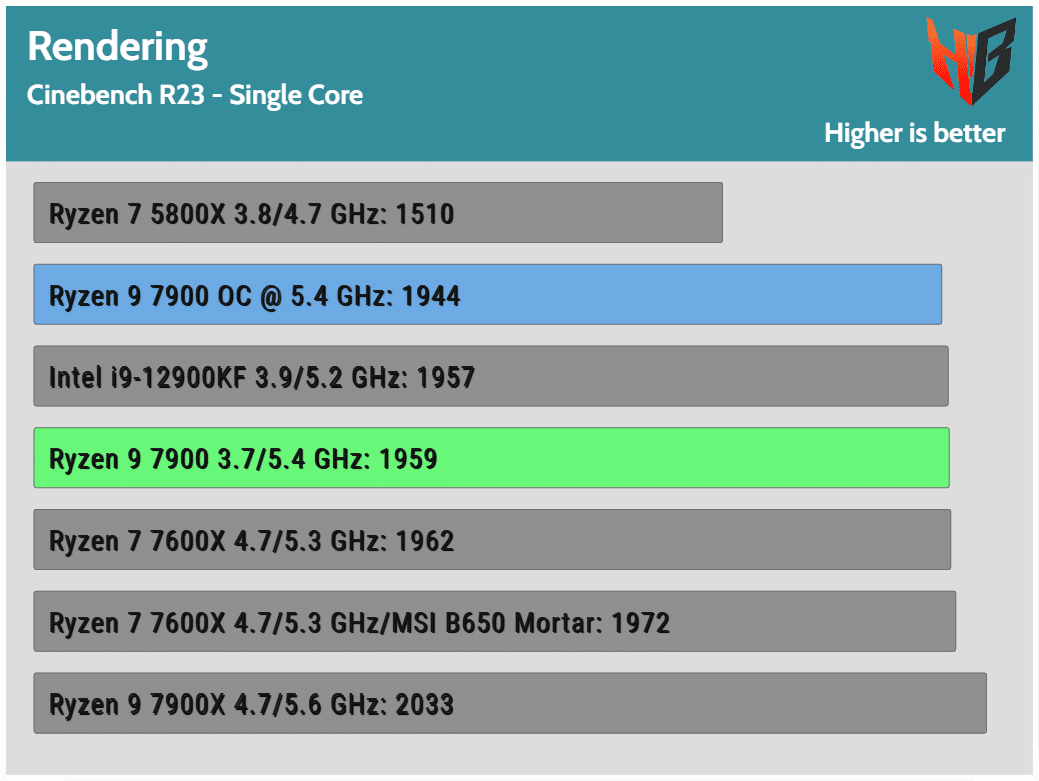
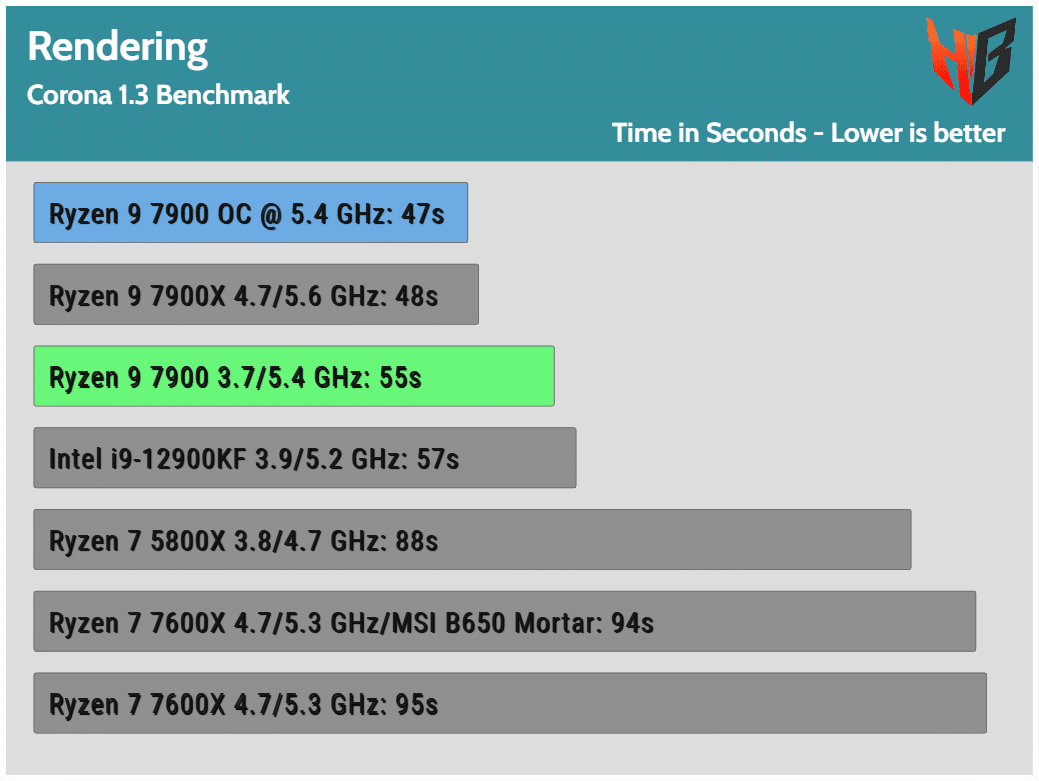
In Blender, I use the BMW 27 scene. The Corona Renderer might be old, but it still provides valuable insights into the CPU’s rendering capabilities.
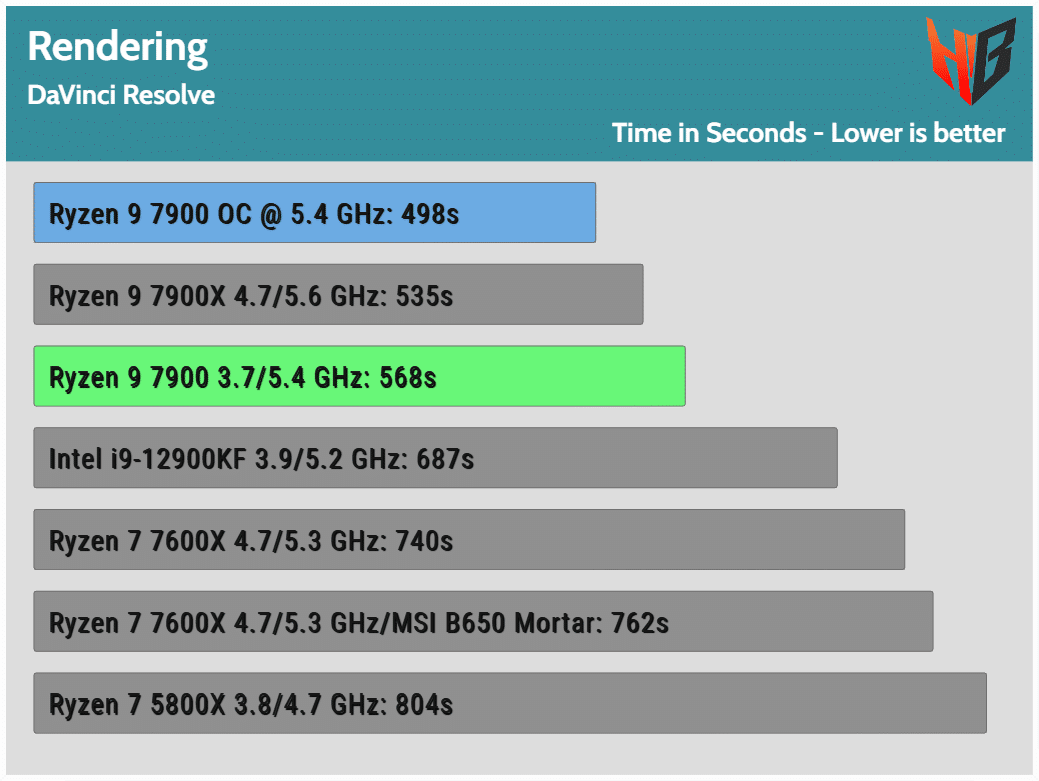
Davinci Resolve is one of the best video editing apps, even in its free version. I use it to extract a 4K video without utilizing the GPU’s capabilities.
Software Development

I compile a large project in Microsoft’s Visual Studio to evaluate all CPUs.
Web Browser Performance
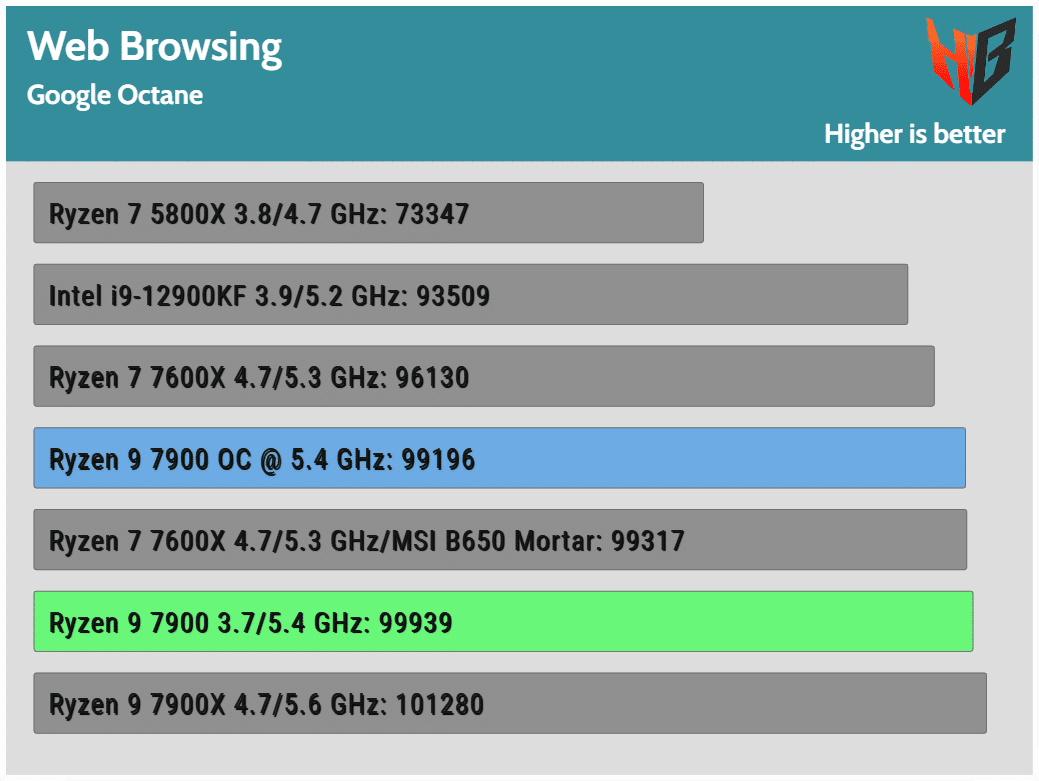
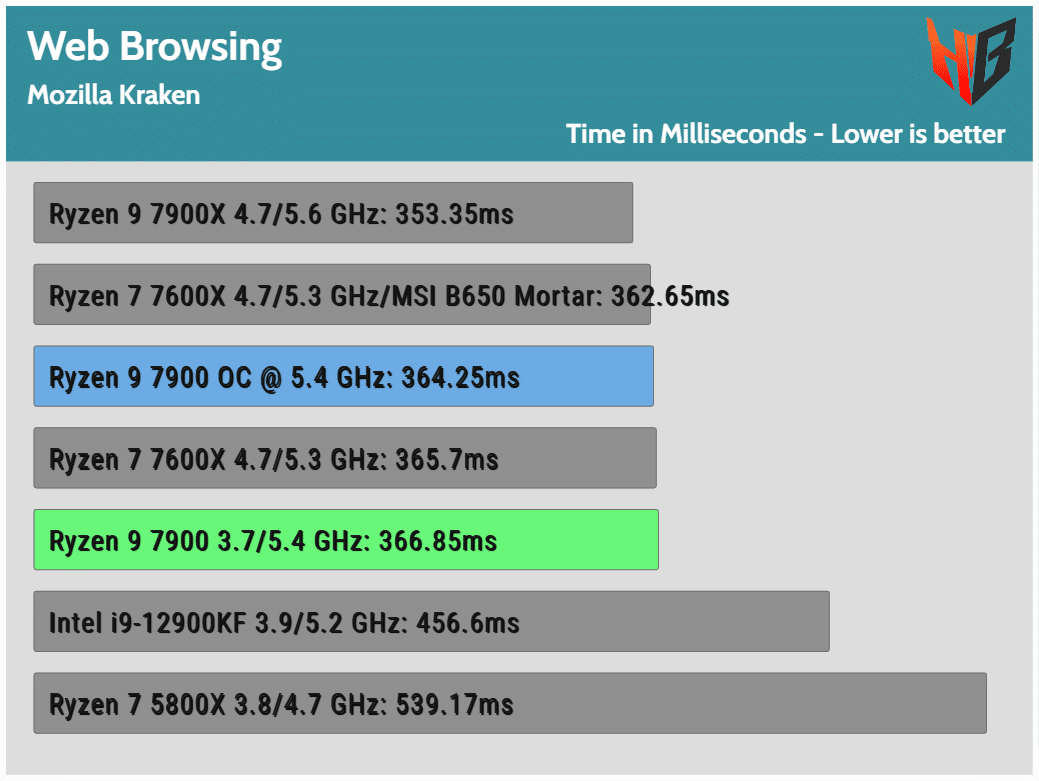
The Google Octane 2.0 tests show the performance of the JavaScript engine. The Mozilla Kraken is similar to the Octane, measuring the execution time of the JavaScript code.
AI – Machine Learning

To fully utilize a machine’s capabilities and solve complex problems, you must train it. The more data you feed it during training, the better becomes its neural network, which is the one that will provide the final results. Tensorflow is based on Python and has been developed by Google. It supports both CPUs and GPUs, but I will only use its CPU support.
Productivity and Microsoft Office
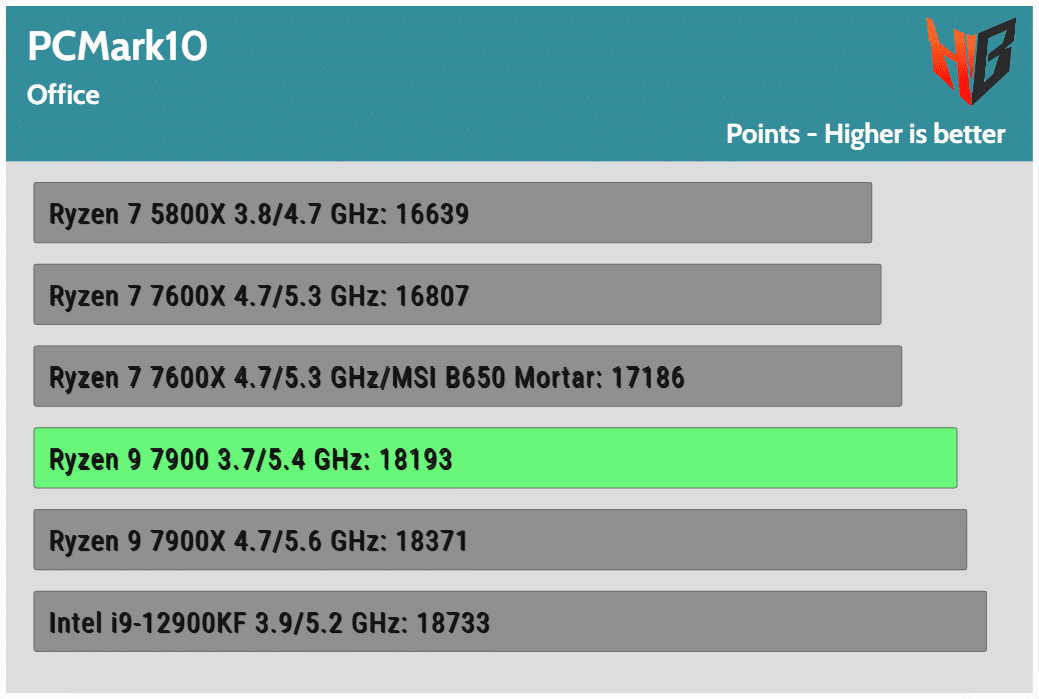
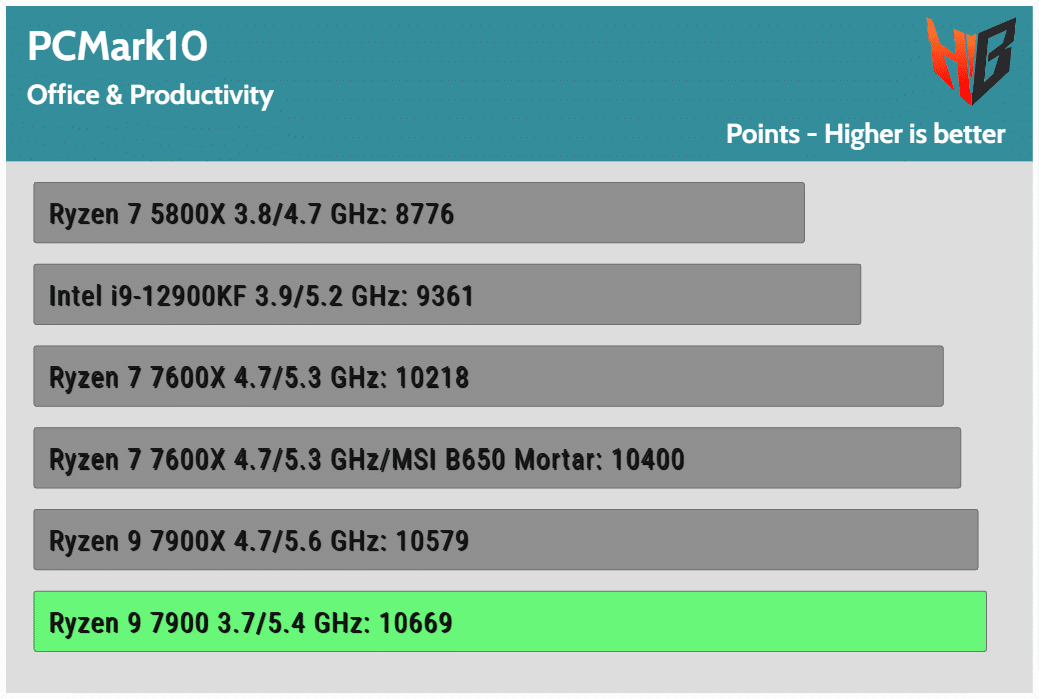
I use the PCMark10 benchmark suite to evaluate all CPUs under several productivity tasks. I also use the Applications Benchmark, which uses all Microsoft Office apps.
Data Compression
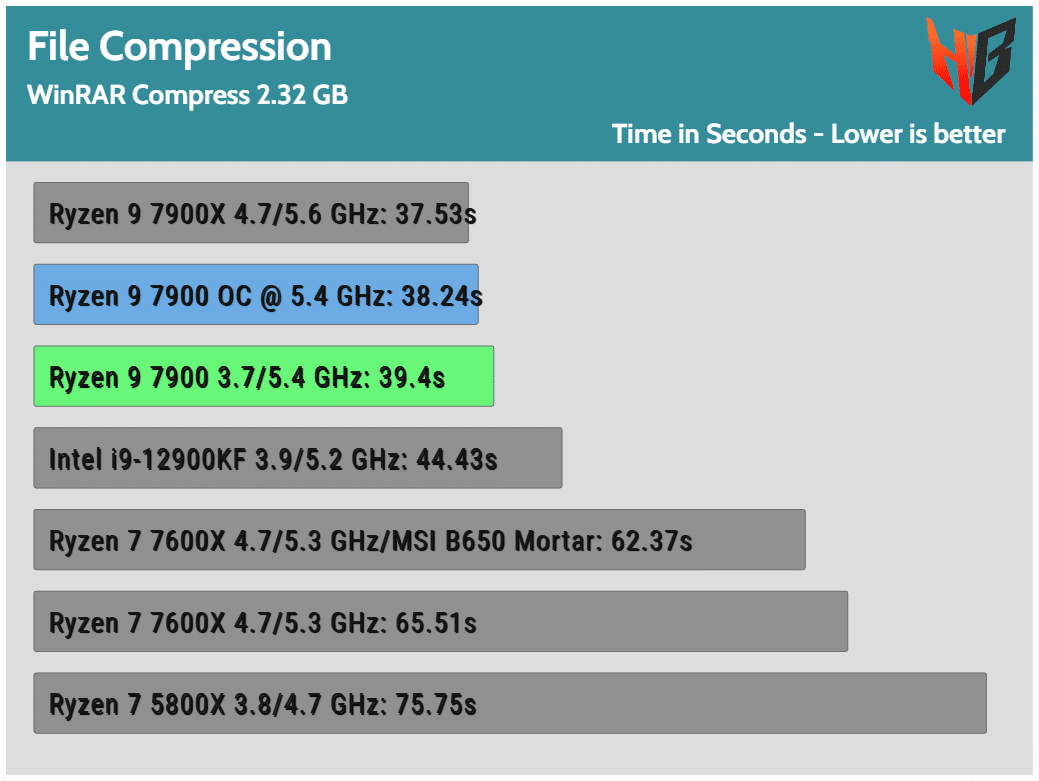
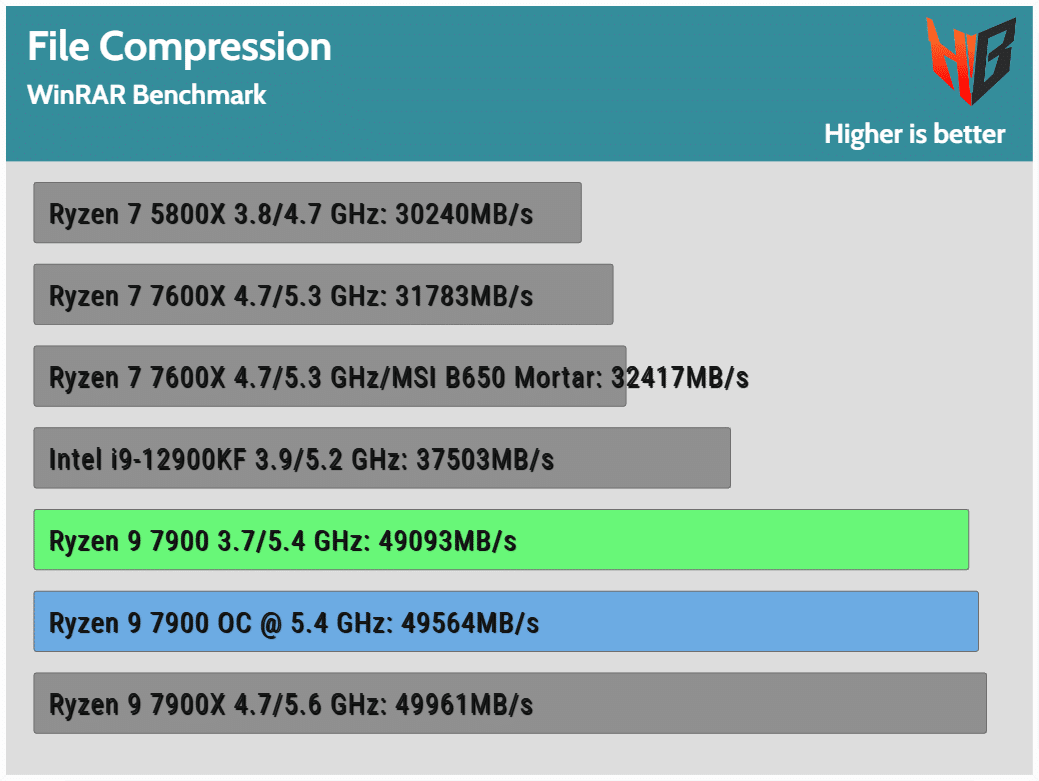
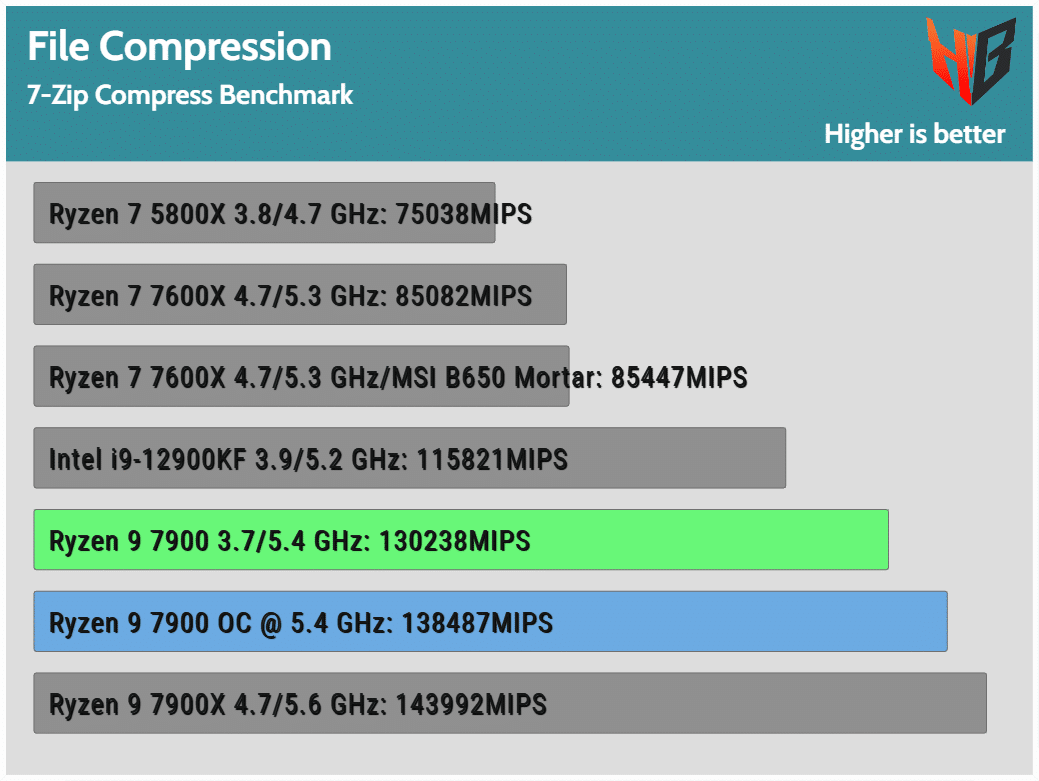
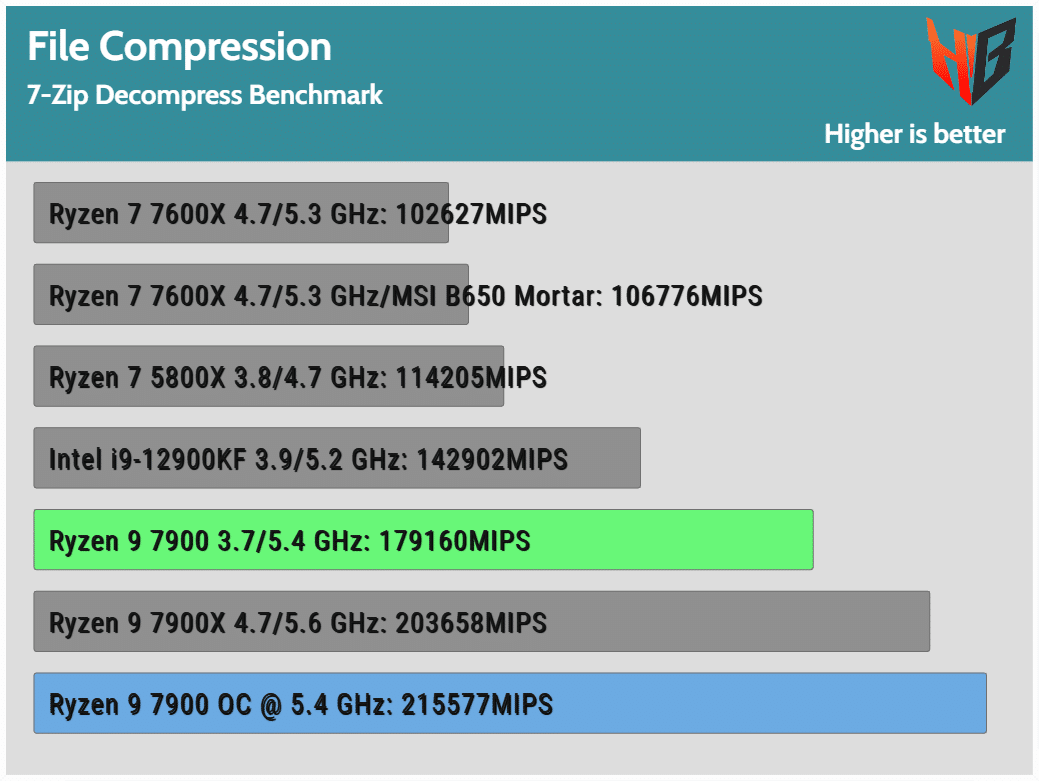
I use two popular compression apps, WinRar and 7-zip. Both have embedded benchmarks, and I also compress a large file folder with WinRar.
Media Encoding
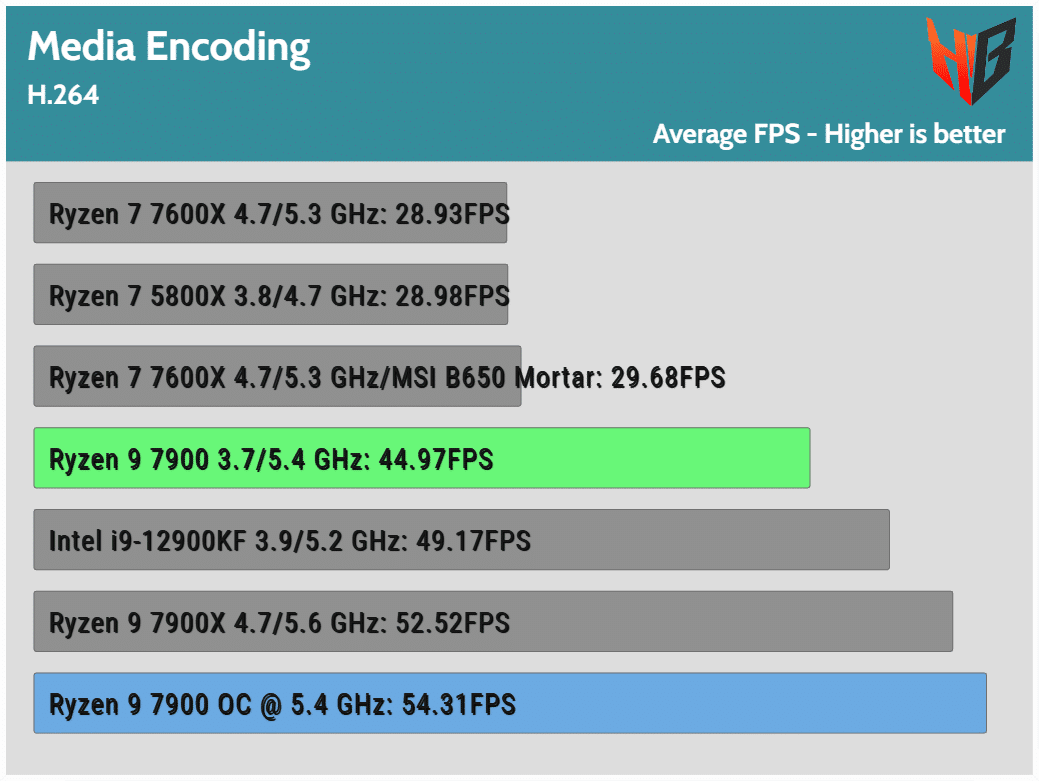

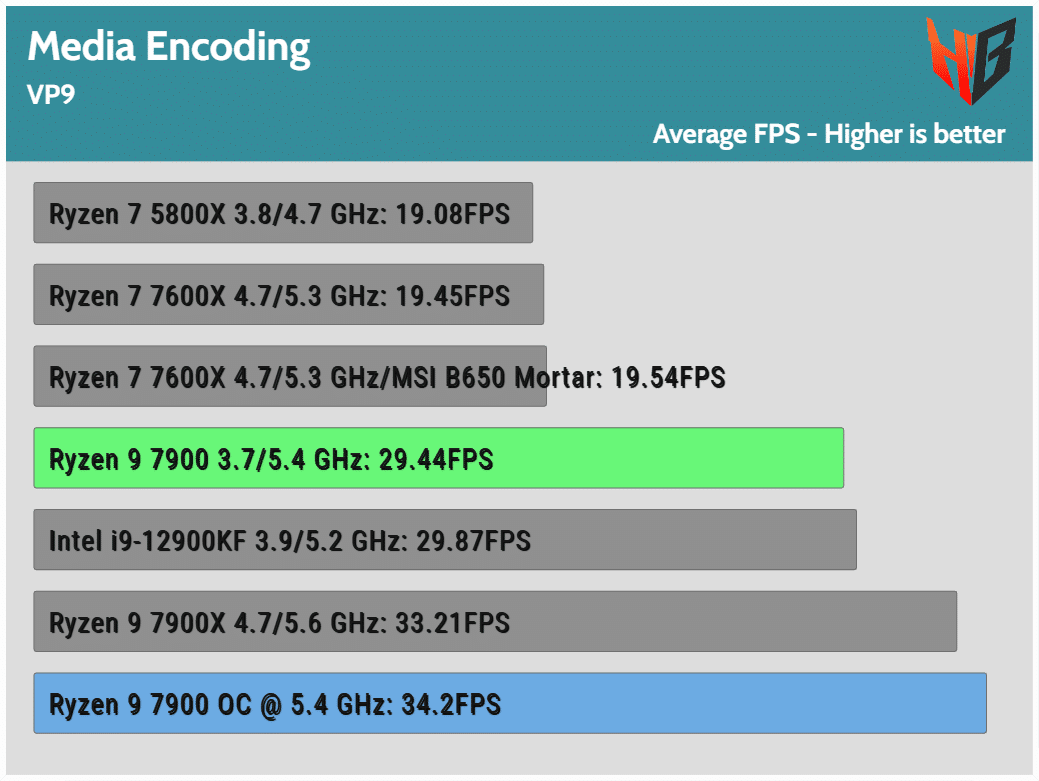
I convert a 4K video to HD format with 30 frames per second with Handbrake, using three different compression algorithms.
Puget Benchmarks
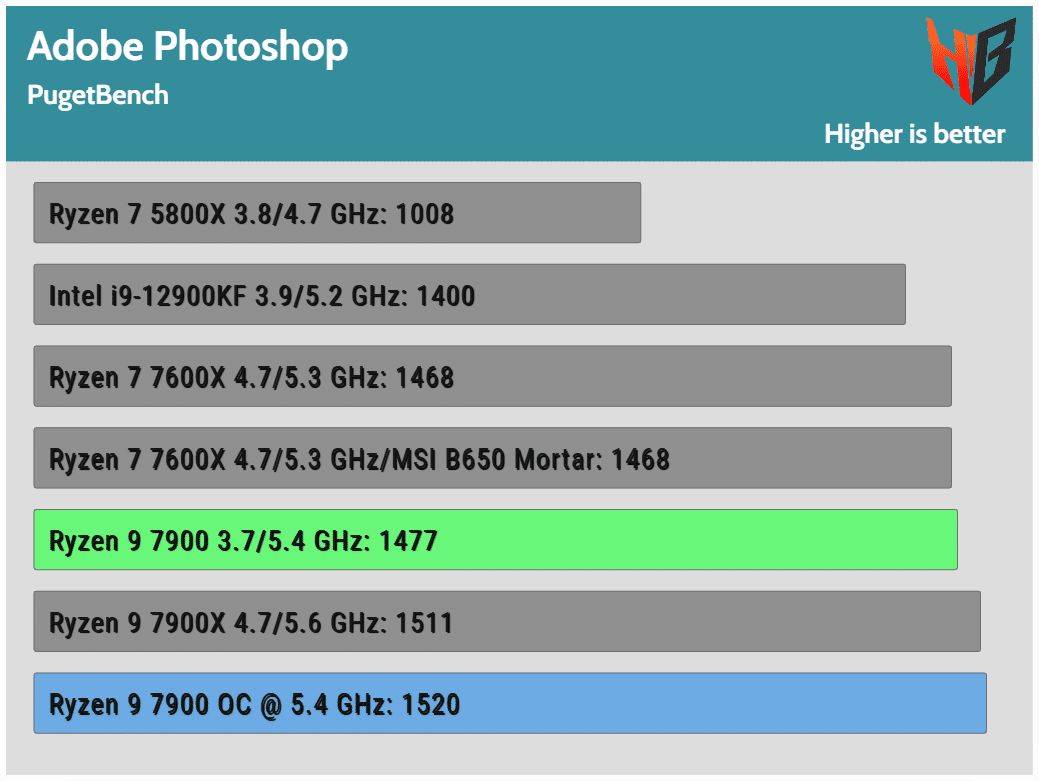

Puget is a PC-building company specializing in video editing systems. To evaluate their systems, they’ve created several benchmark tests for popular video and photo editing applications. They were also kind enough to provide free (and paid) versions of them to the rest of the world.
HD Game tests
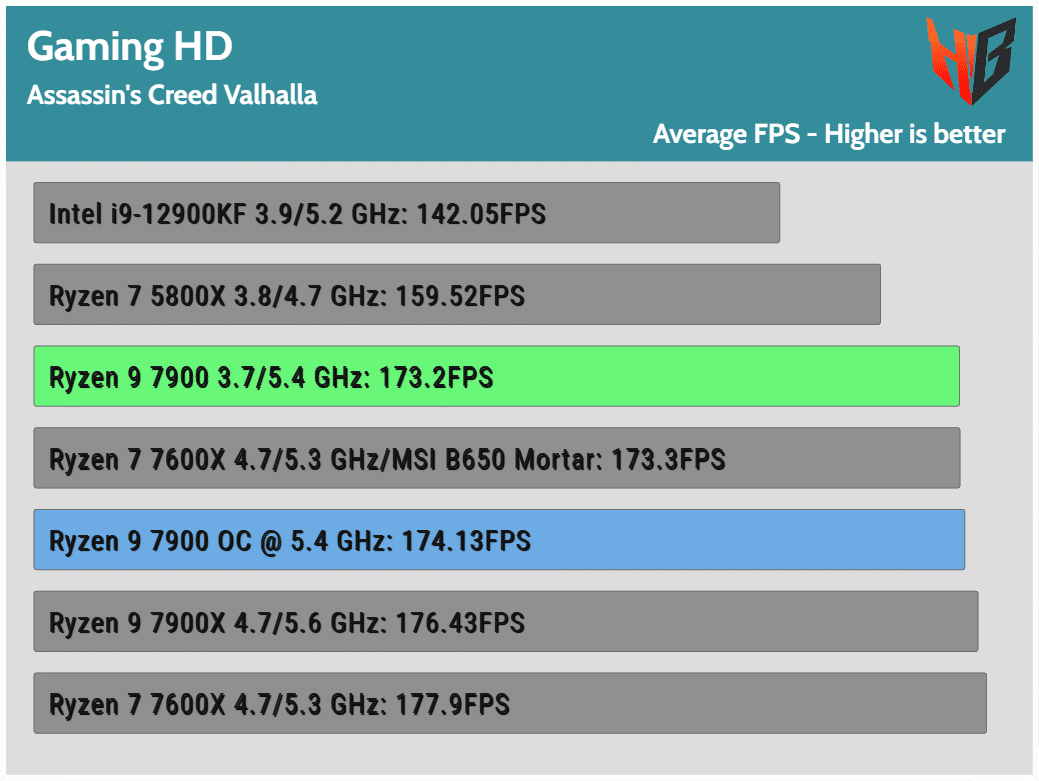
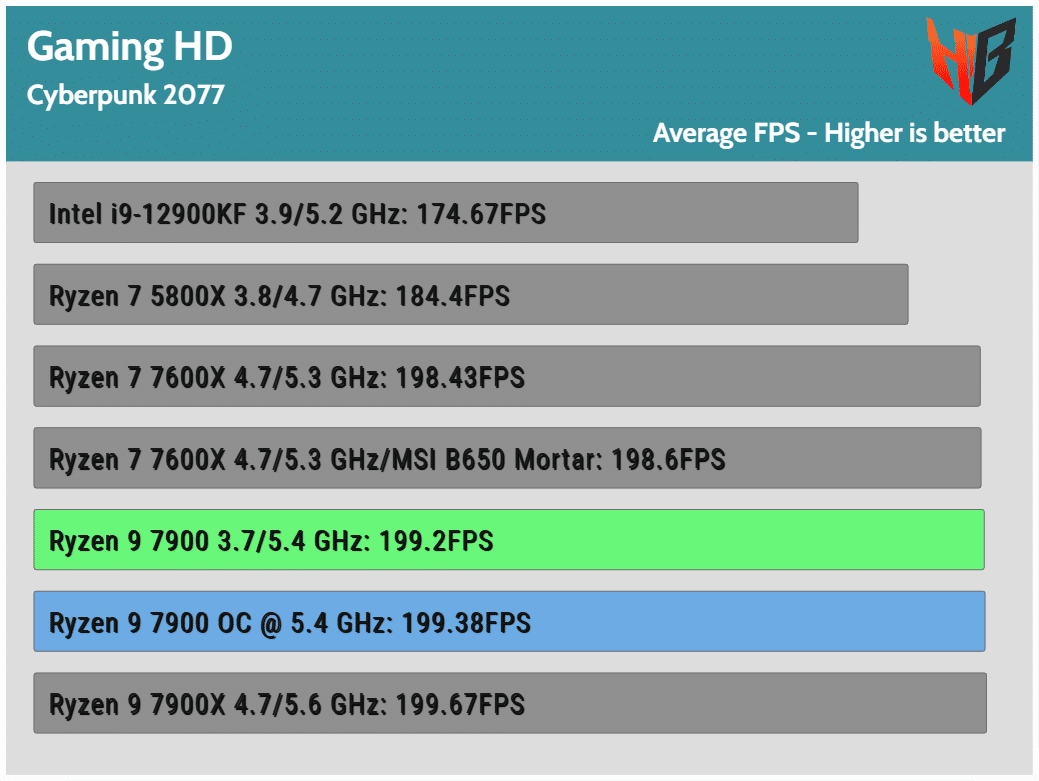
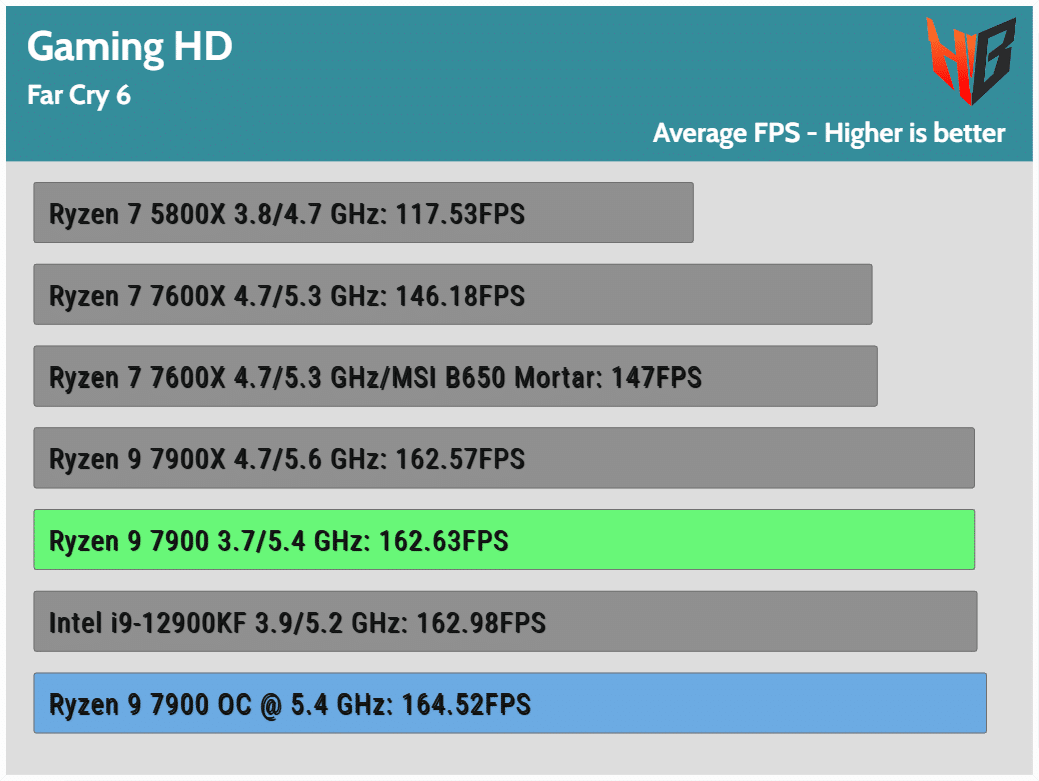
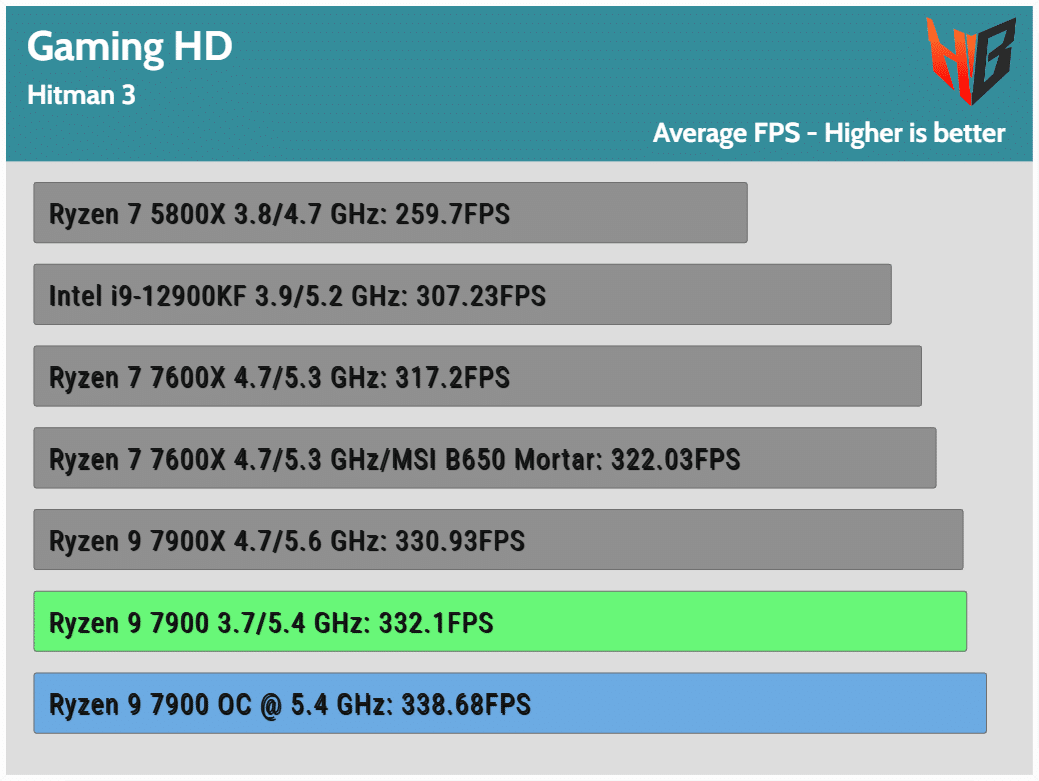
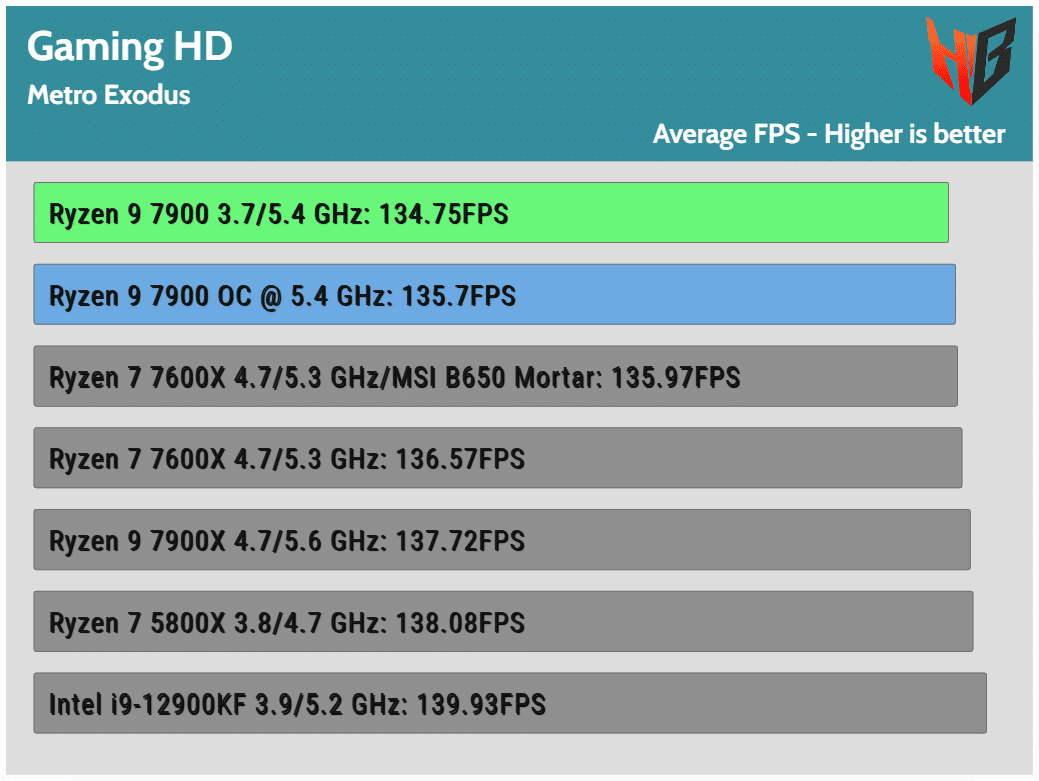
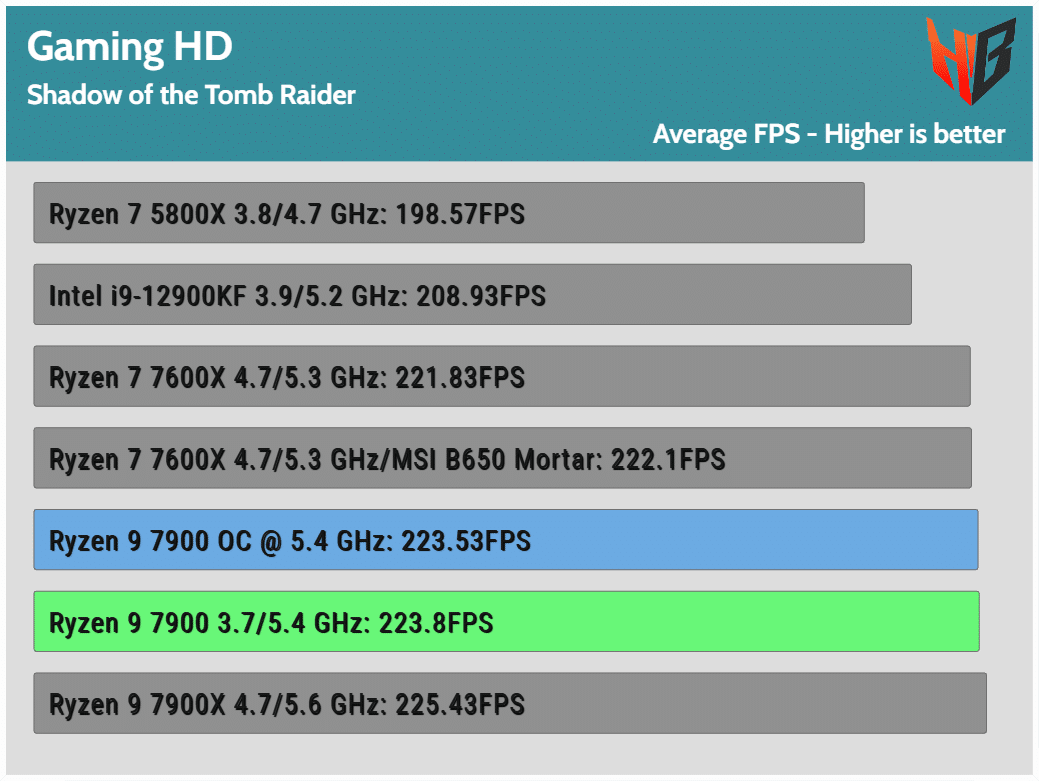
Using a potent GPU at low resolutions, I ensure there is no bottleneck in this section to check the CPU performance differences easily—all games run at HD resolution and the highest possible setting, without RTX.
Power Consumption
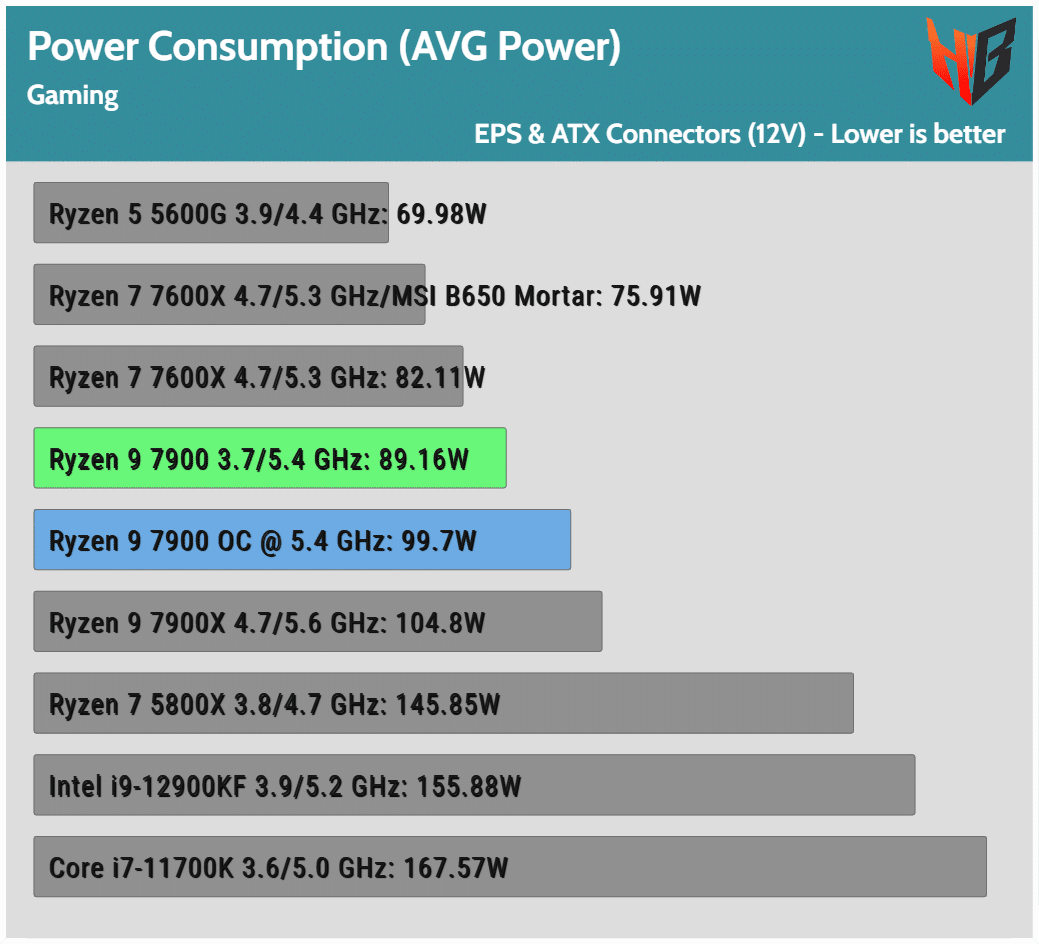

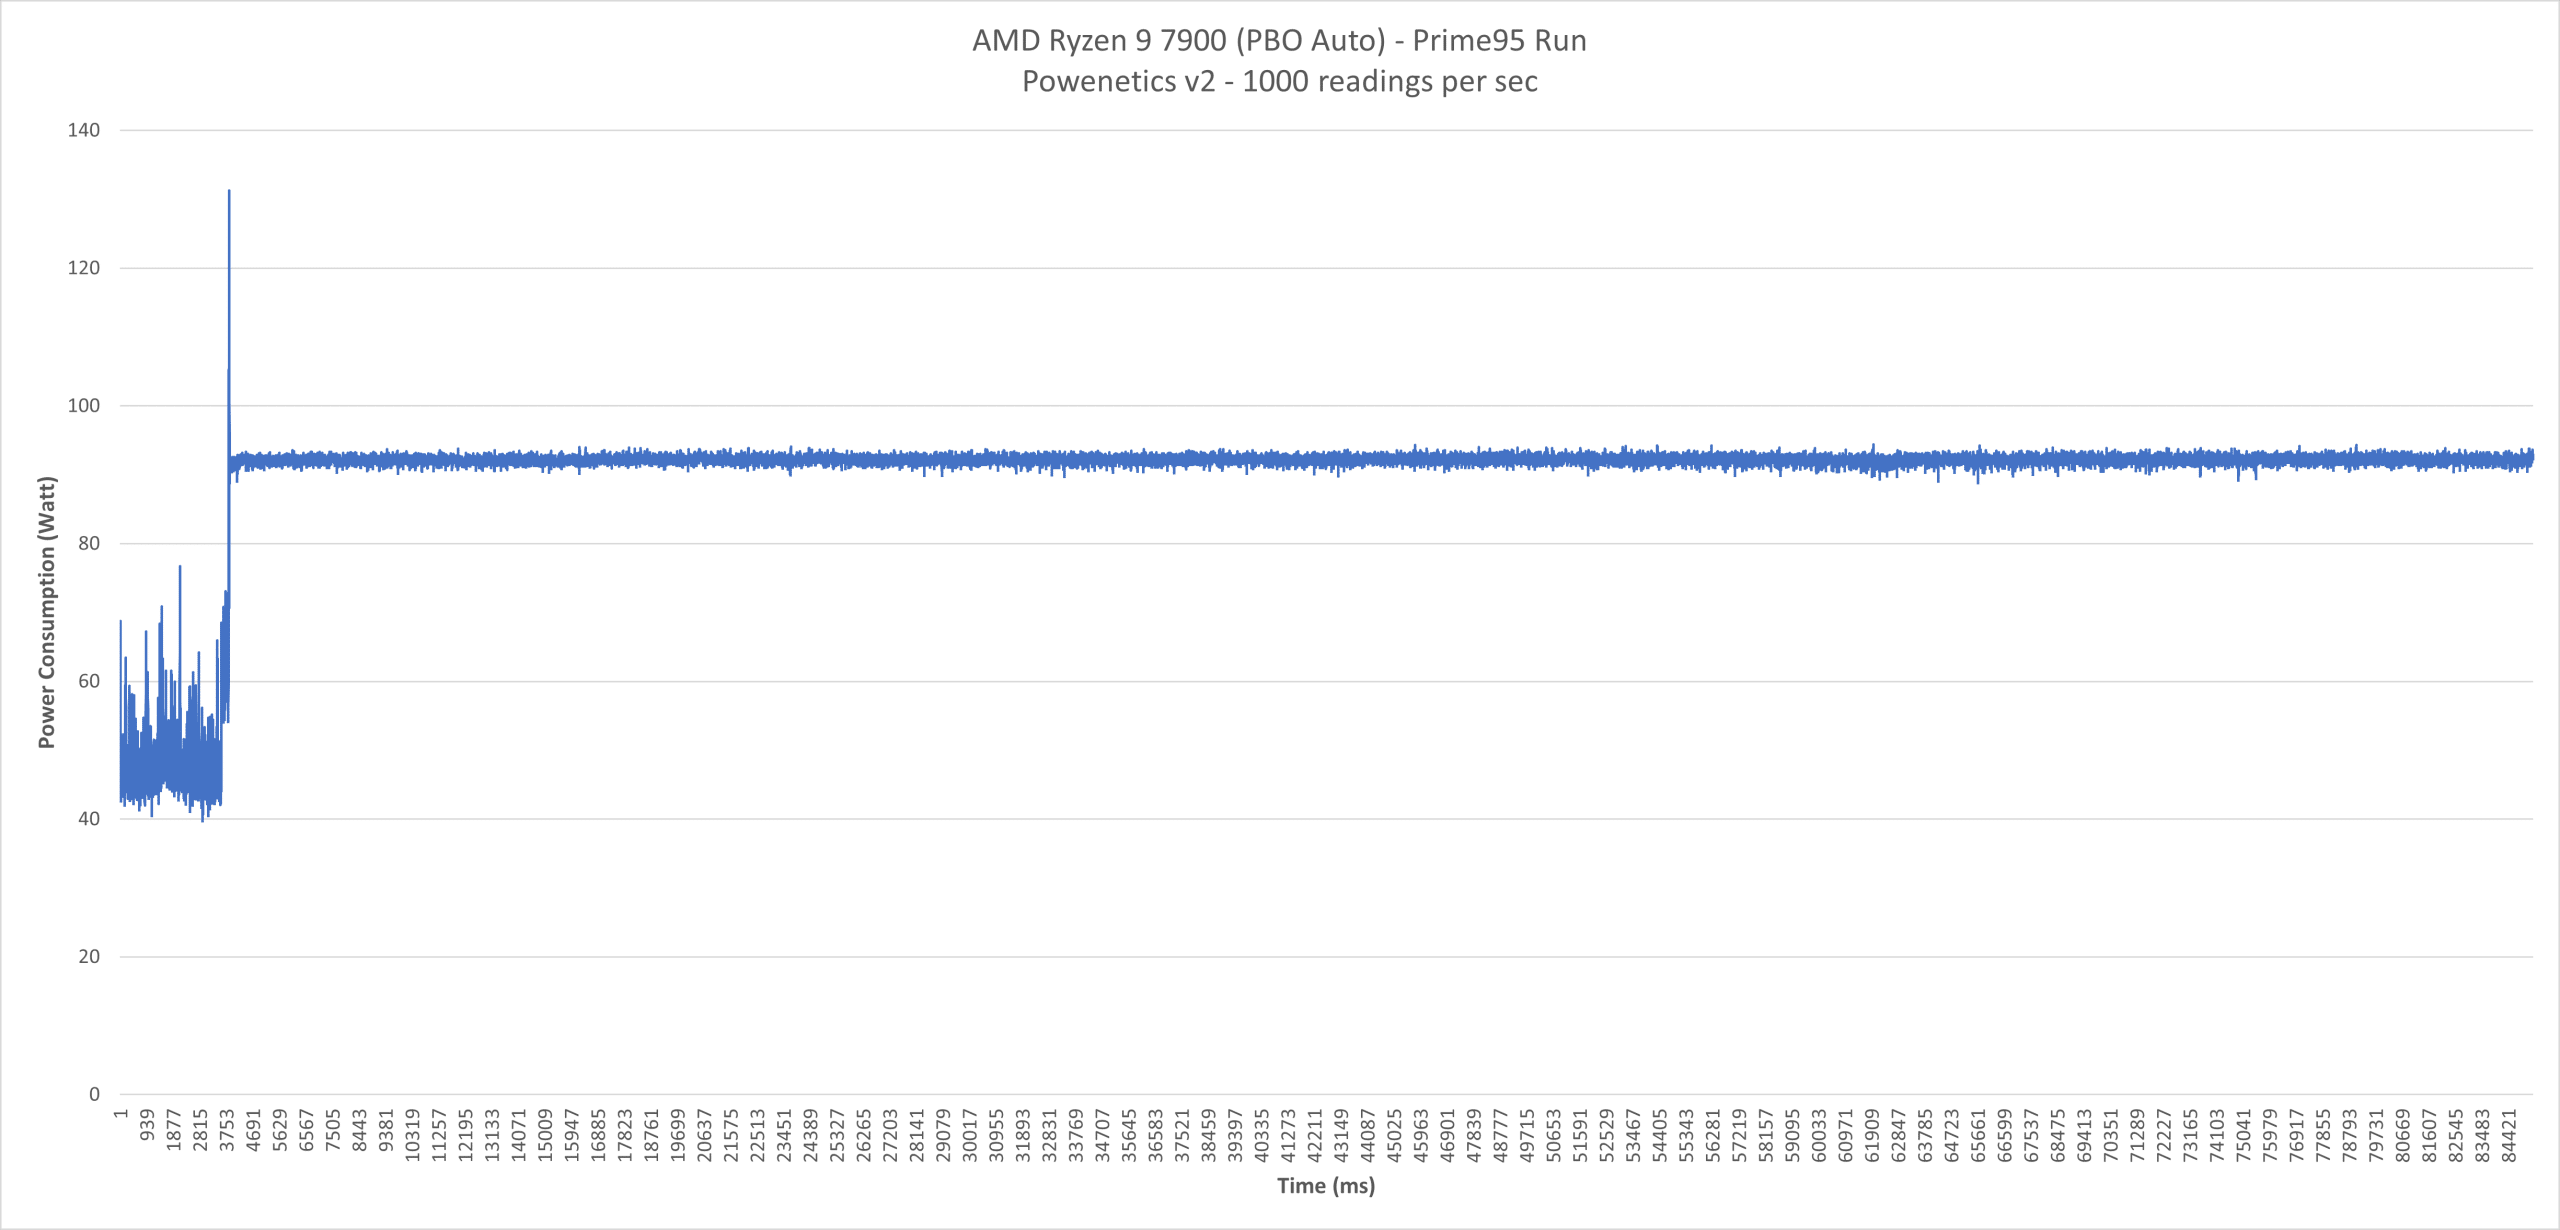
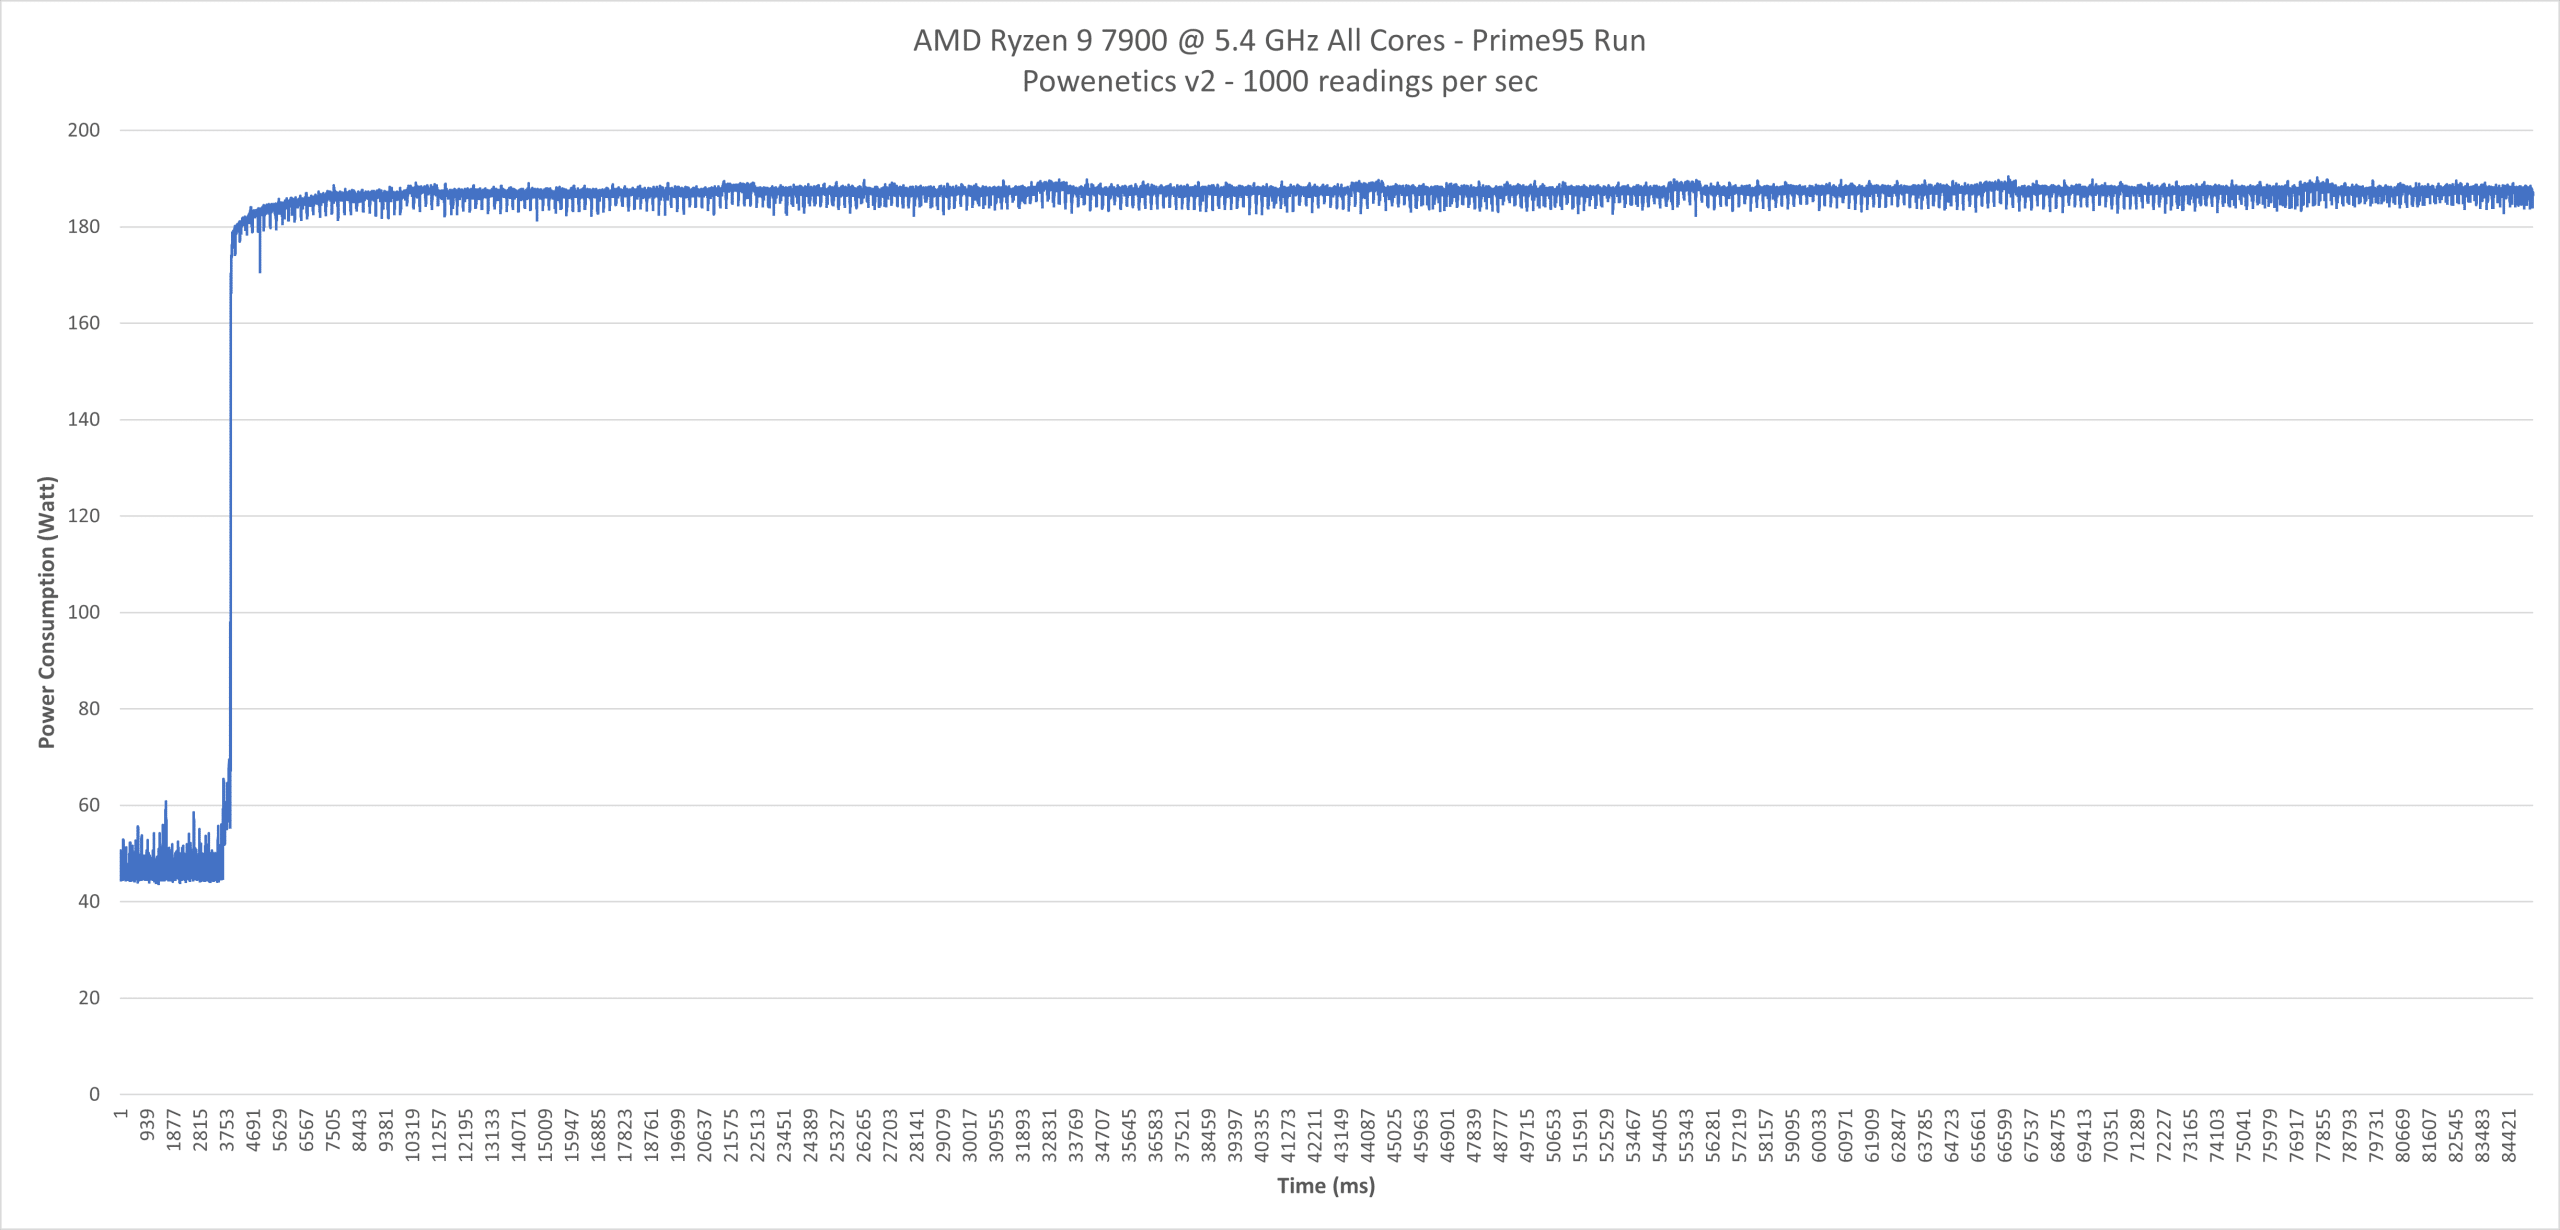
I use the Powenetics system to measure power consumption in every significant part of the mainboard, with up to 1000 readings per second.
Peak Power Consumption
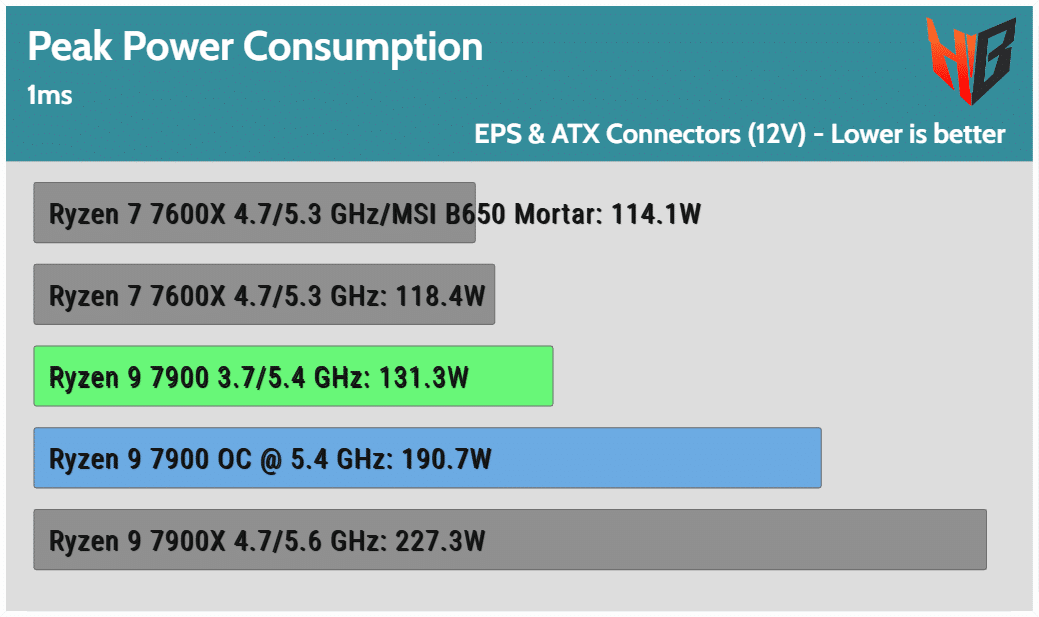
I obtained the peak power consumption readings shown in the graph above during the start of the Prime95 benchmark.
The power spikes are notably lower, with the CPU in overclocked mode. This is weird.
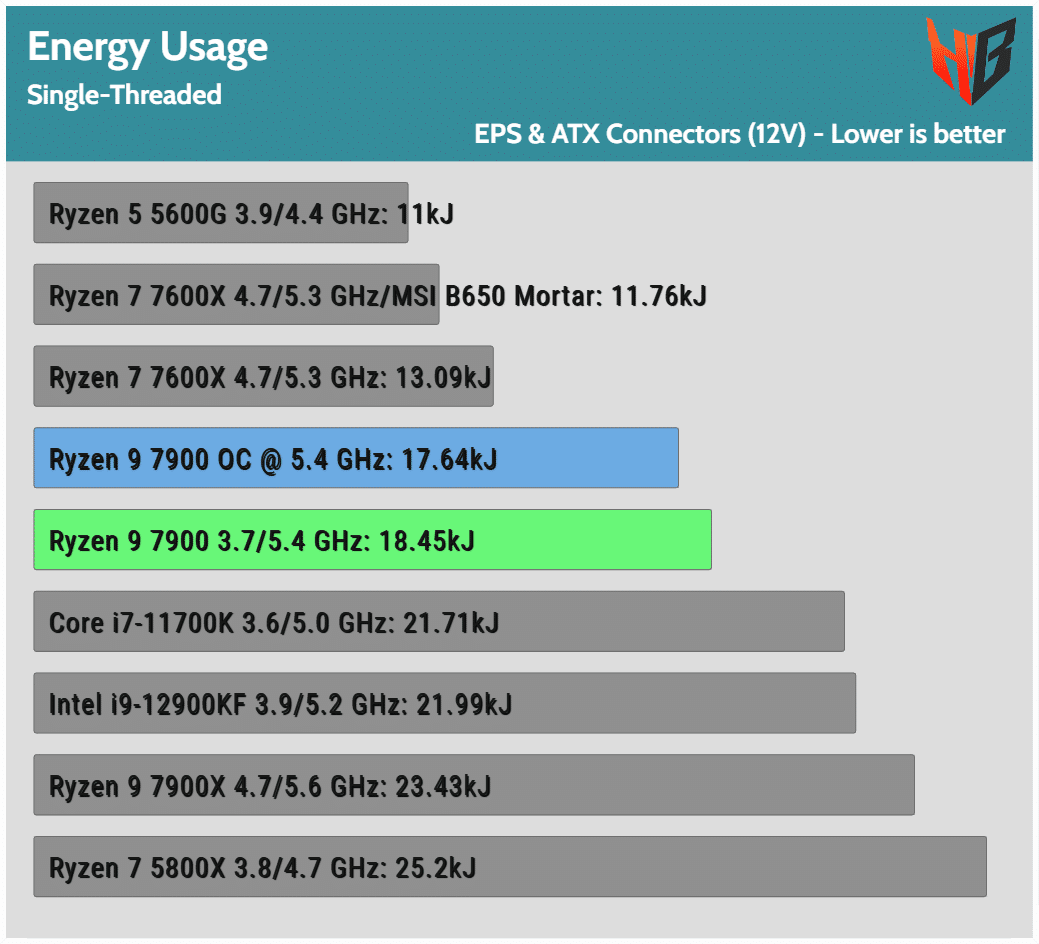
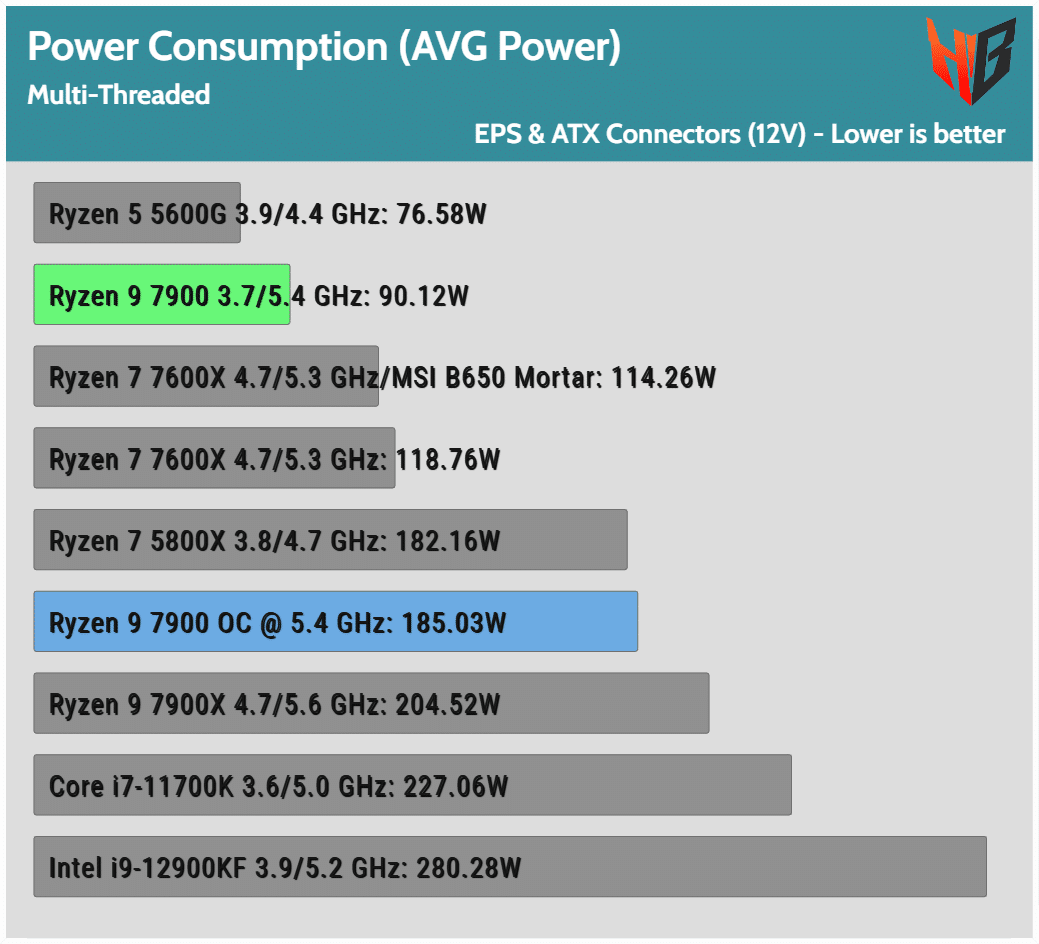
Energy Usage
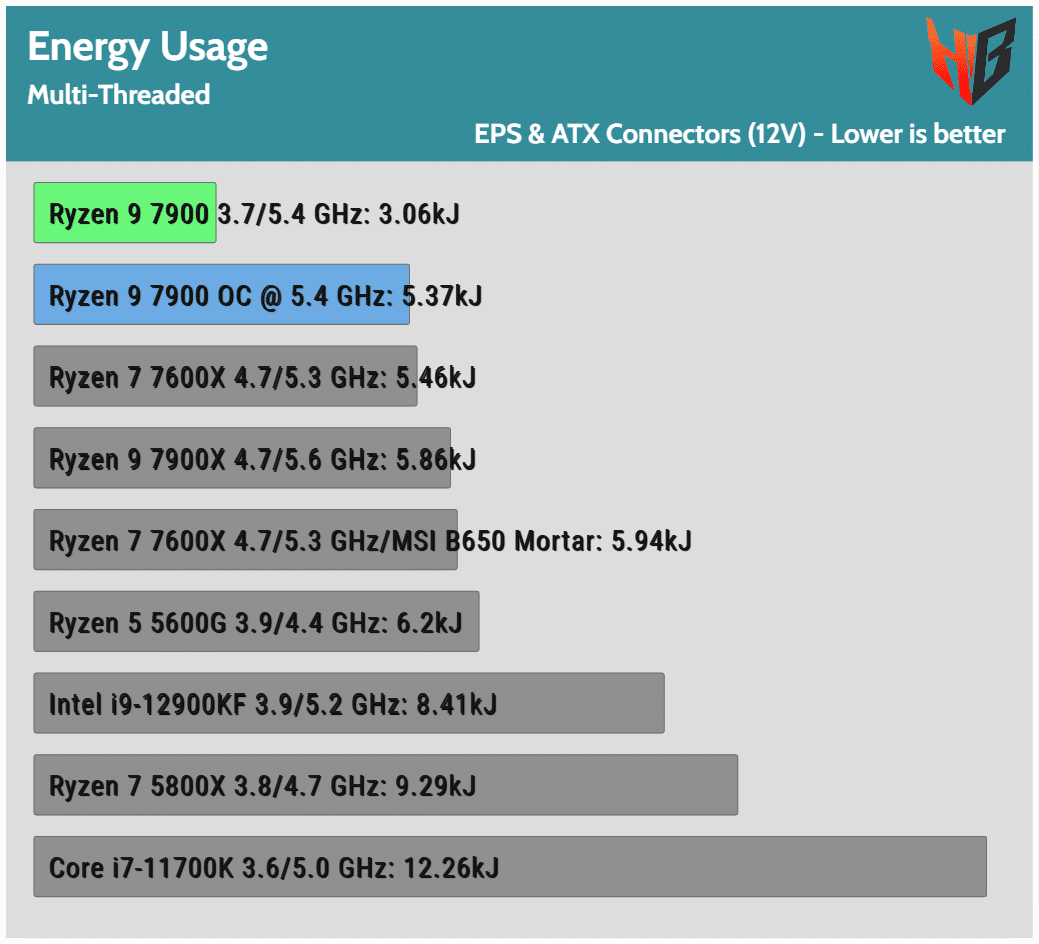
Even under overclock, energy usage is not high. Nonetheless, the difference with stock conditions is vast in multi-threaded apps.
Max Operating Temperature
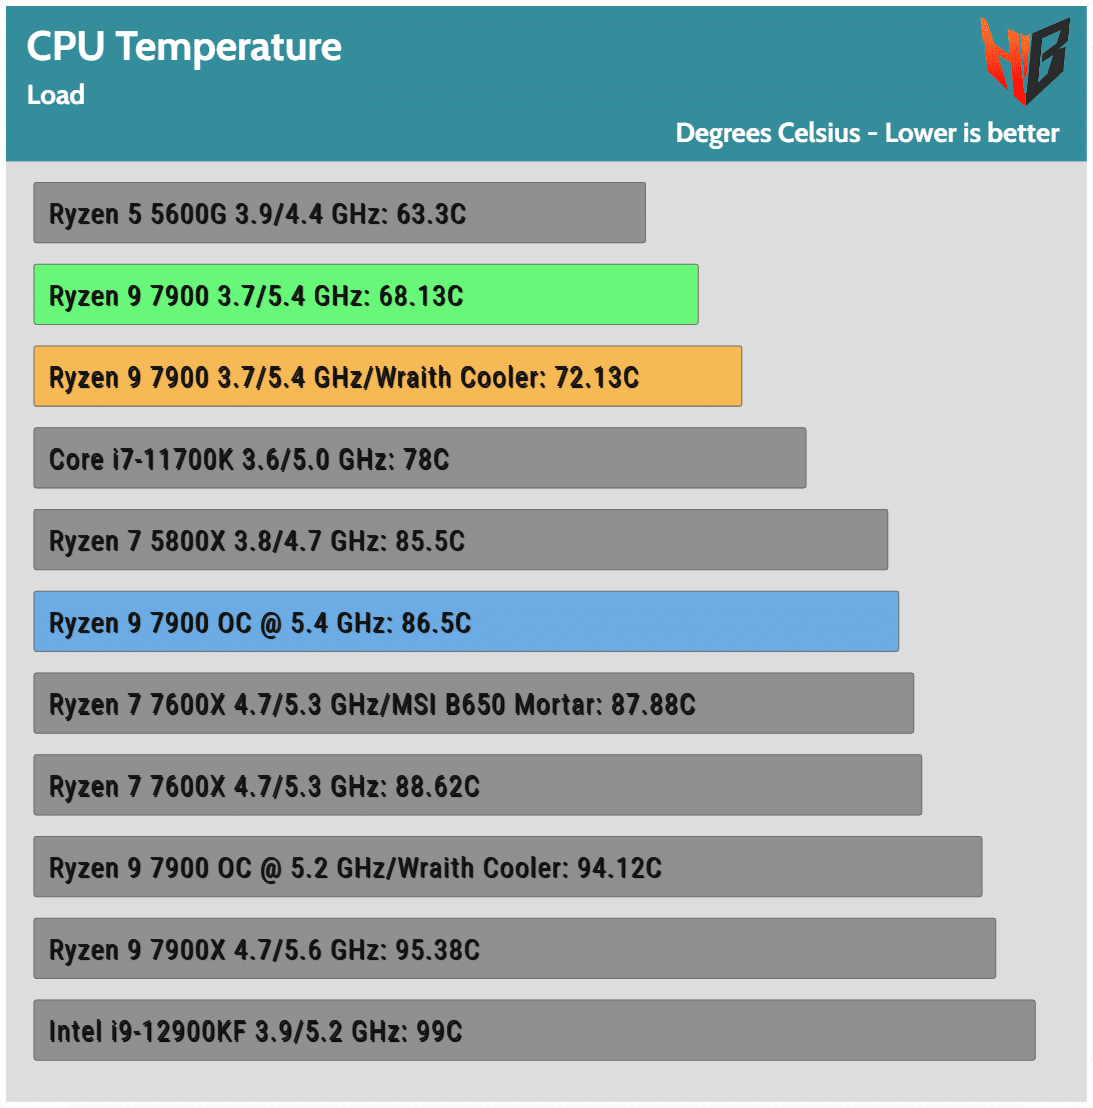
To check the operating temperatures, I run Blender instead of Prime95 and small FFTs, which apply an unrealistically high load to the CPU.
According to AMD, the 7000 series can run all day at 95C without any issues. From default, the max temperature limit was set at 95C, and as you can see in the graph above, the CPU can reach it during a demanding benchmark, even with a strong cooling solution like the Noctua NH-D15S.
Asus allows you to set lower max temperatures if you don’t want to see 95C, and there is an excellent article about it showing the effect on performance. You will find it here.
Overclocking
Overclocking the 7900 is a real joy, contrary to its big brother, the 7900x, which doesn’t leave any headroom because of the high TDP. You only have to increase the multiplier, unlocked on all 7000 CPUs, to the desired level. I went up to 5400MHz with the RAM set at 6000MHz and FCLK at 2000MHz. I left all other options at auto since I had no time for experiments. I have already included overclocked performance in most charts above. The major differences are in rendering and applications that use many threads. The only downside is that power consumption goes through the roof. In Cinebench, from 90.12W, the average power consumption went up to 185.03W.
Overall & Gaming Performance
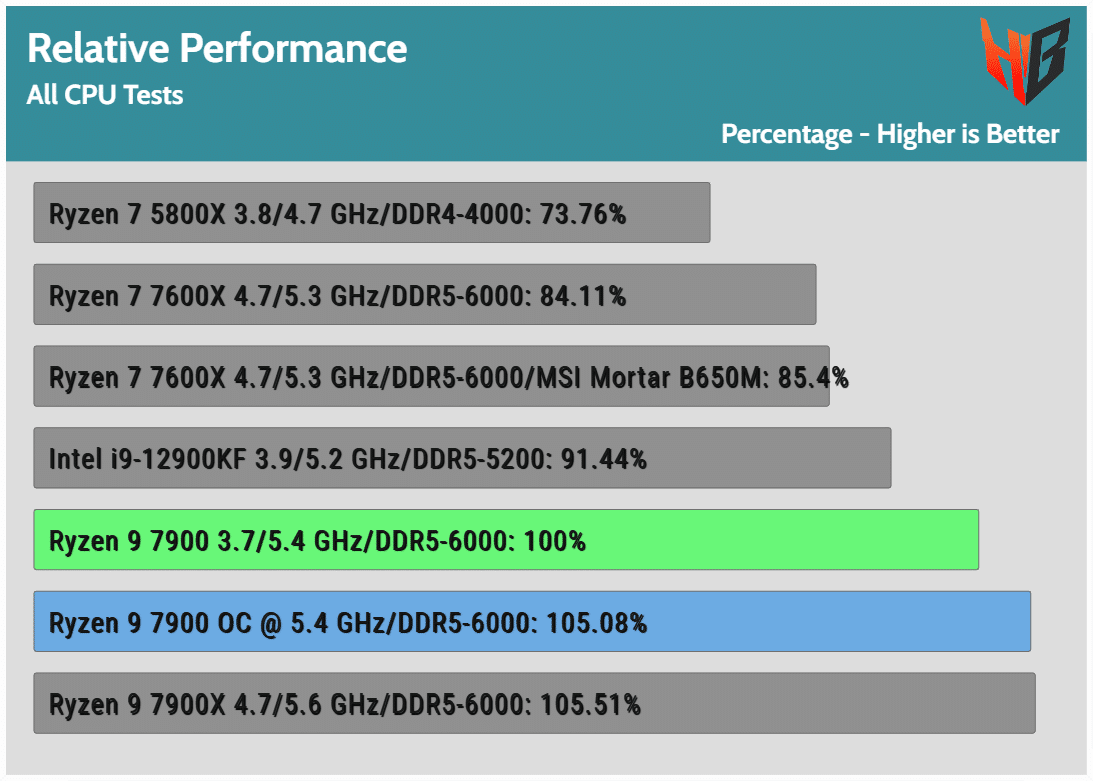
With overclocking, the overall difference is 5%, which is notable. As you can see in the graph above, the overclocked processor is at about the same level as the 7900x. Given that the price difference is around 100 dollars between these two processors, I am not sure if it is worth it.
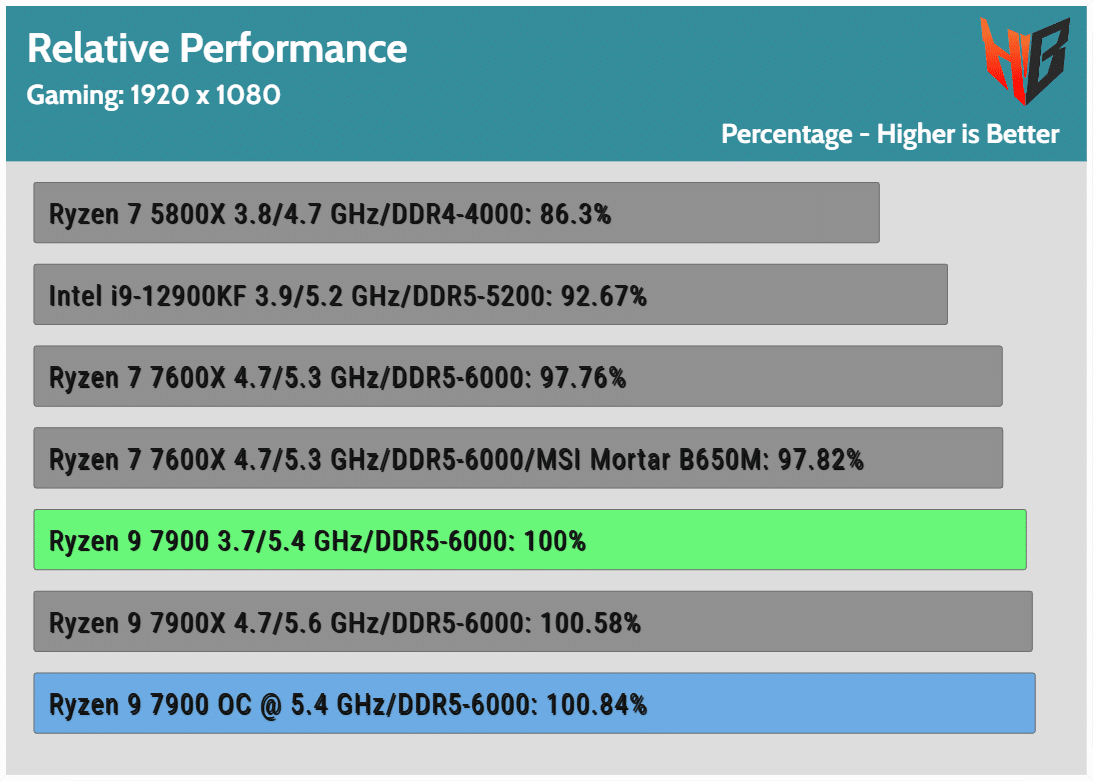
The gaming performance difference is minimal.
Epilogue
The Ryzen 9 7900 proved an excellent overclocker, offering a notable performance increase over the stock speeds and TDP. Power consumption is hugely increased, and the stock cooler will have difficulty handling the increased temperatures. If you want to listen to my advice, I wouldn’t bother overclocking this CPU. I would keep it at stock speeds, where energy efficiency is awesome! Especially in gaming, the difference is minimal, while in overall performance is at 5%. The added bonus with the 7900 is that it doesn’t have special cooling requirements, thanks to its low TDP if you leave it at stock speeds. The highly capable Wraith Prism RGB cooler, which AMD bundles with this CPU, is perfect, and you won’t need more unless you take the overclocking way. If I were to choose between the AMD Ryzen 9 7900x and the 7900, I would probably go with the second because energy efficiency matters the most to me.
Unfortunately, my graphs don’t include Intel’s 13th-generation CPUs because I don’t have any contacts with this company’s CPU department. Still, from what I read on Wizzard’s reviews at TechPowerUp, the i7-13700K is around 2-3% faster than the Ryzen 9 7900x in applications, and given my results, the difference with the Ryzen 7900 is at 8-9%. If you want a CPU for gaming only, I suggest you choose a single CCD Ryzen processor because the performance difference is small, and they are affordable. The platform cost might be high, but you will have to move to DDR5 memory at some point. The mainboard prices could be lower, and you should keep in mind that there is no need to invest in an expensive X670(E) mainboard unless you need the extra PCIe lanes and USB ports. A lower-cost B650 mainboard will do just fine, and you won’t lose anything in performance, according to my findings in this review.
Before closing this review, I would like to add that the problems I faced with long boot times were solved once I discovered the “Memory Context Restore” BIOS option in my Asus mainboard, which needs to be set to “Enabled.” Wizzard was kind enough to add this information to one of his reviews; it was a lifesaver! This option shaves off boot time because it saves an amount of memory training info after the first attempt and reuses that on subsequent reboots.
- High performance
- Good overclocker
- Highly efficient
- PCIe 5.0 support for both storage and graphics
- Integrated GPU
- AM5 retains cooling compatibility with AM4
- Unlocked multiplier
- DDR5 support
- AVX512 and AI instructions support
- Bundles with the capable AMD Wraith Prism RGB cooler
- Needs a price cut to become more competitive
- Increased platform cost
Hi, GREAT ARTICLE AND AWESOME INFO. YOUR EFFORTS IS AMAZING. AND IS RYZEN 9 7900 GOOD FR 4K EDITING, 2k/4k GAMING AND STREAMING AND CAN I PAIR IT WITH 4070 SUPER GPU.
Yes, the 7900 is still a great CPU and can easily support a 4070 Super.
Thank you for your extensive review on the Ryzen 9 7900.
Thanx for your comment.
Thanks for the great review Aris!
I particularly liked the minimal gaming difference in overclock which is very enlightening, meaning there is no real reason to spend countless hours in trial-and-error trying to overclock this, unless perhaps someone has a boatload of background apps running (and even then i dont think this chip will chicken out).
My pleasure 🙂
7900>7900x for sure. Lets see the 3d versions already! 28-2