Data Analysis
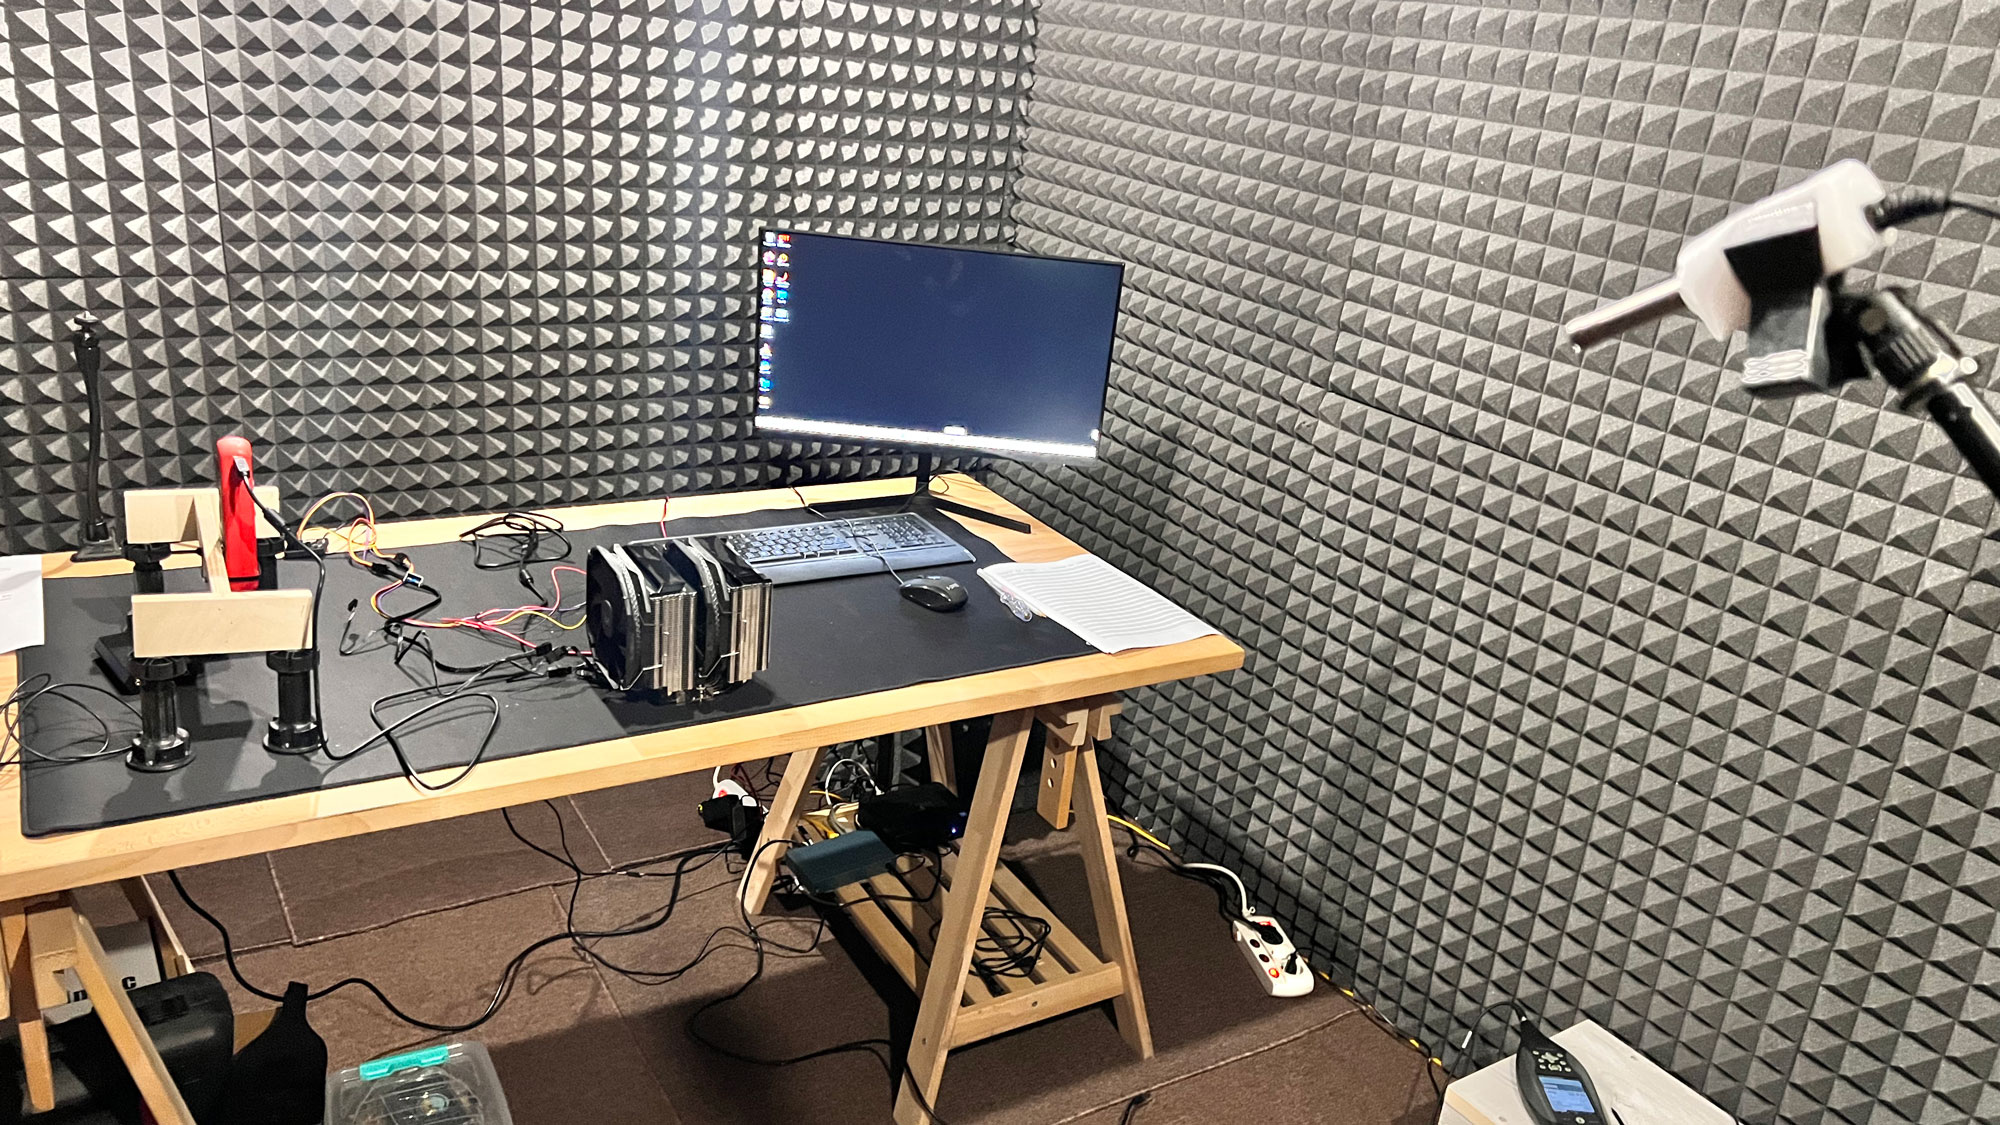
Besides requiring hours and hours of testing, data analysis is also a pain. This is why I made special programs to help me effortlessly process thousands of data readings. The data from Jalapeno is relatively easy to process since I only have a bunch of temperature probes and a single number representing the heat load applied to the cooler. On the contrary, I have too much data to process in the real system, including the data from the Powenetics system.
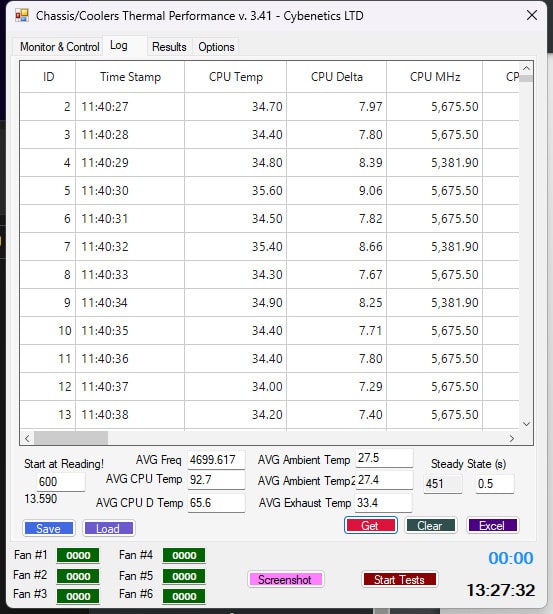
By pressing “Get” I get all essential readings. I can also get the time required for the cooler to reach a steady state where its temperature is within 0.5 degrees Celsius of the maximum. I can set where to start taking into account the readings from which the results are derived. In the screenshot above, I start at the 600th measurement, which means 10 minutes after the first reading. I need to emphasize the AVG CPU Frequency readings, which are crucial because, under heavy loads, the CPU’s frequency drops, so it is essential to take it into account because it directly affects its temperature.
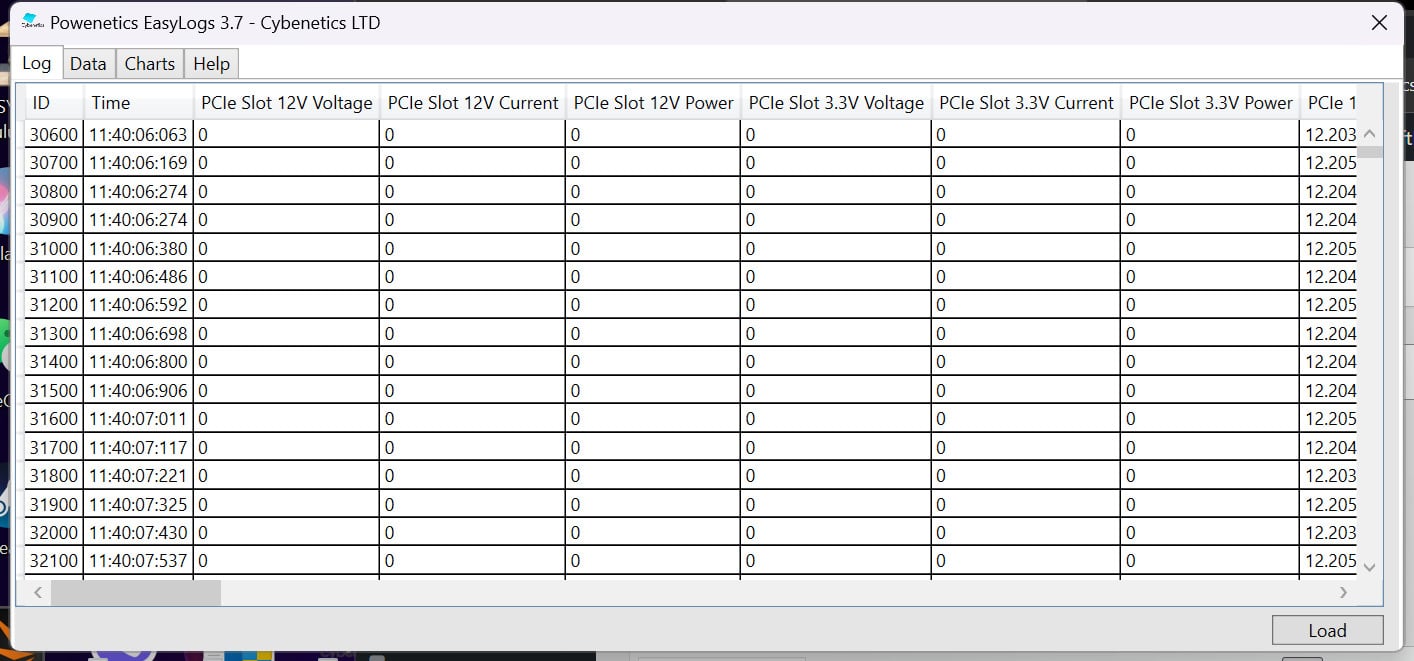
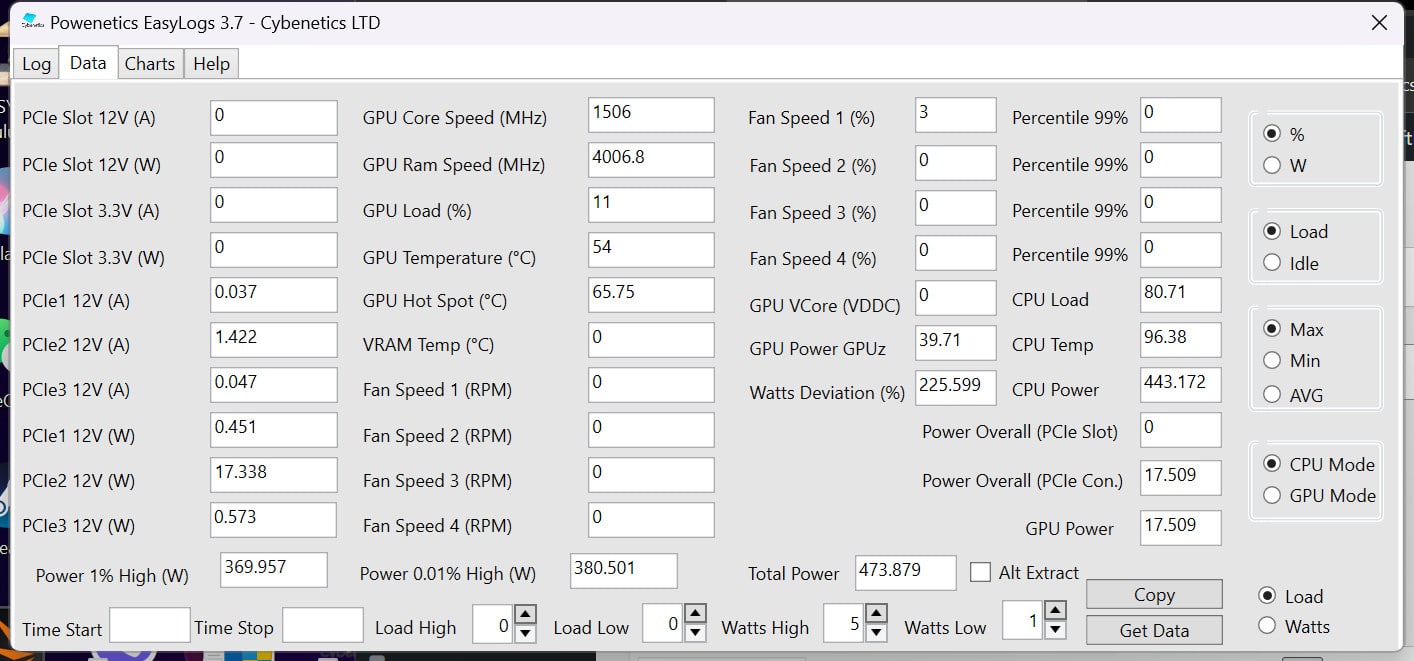
I have made a dedicated application to process the vast amounts of data the Powenetics app provides. Since I have timestamps in all applications, I can set the start and stop time intervals for even more precise results. This is because I let the Powenetics app run throughout all testing on the real system without interruptions. I had to find a way to extract precisely the data I needed.