Power Consumption
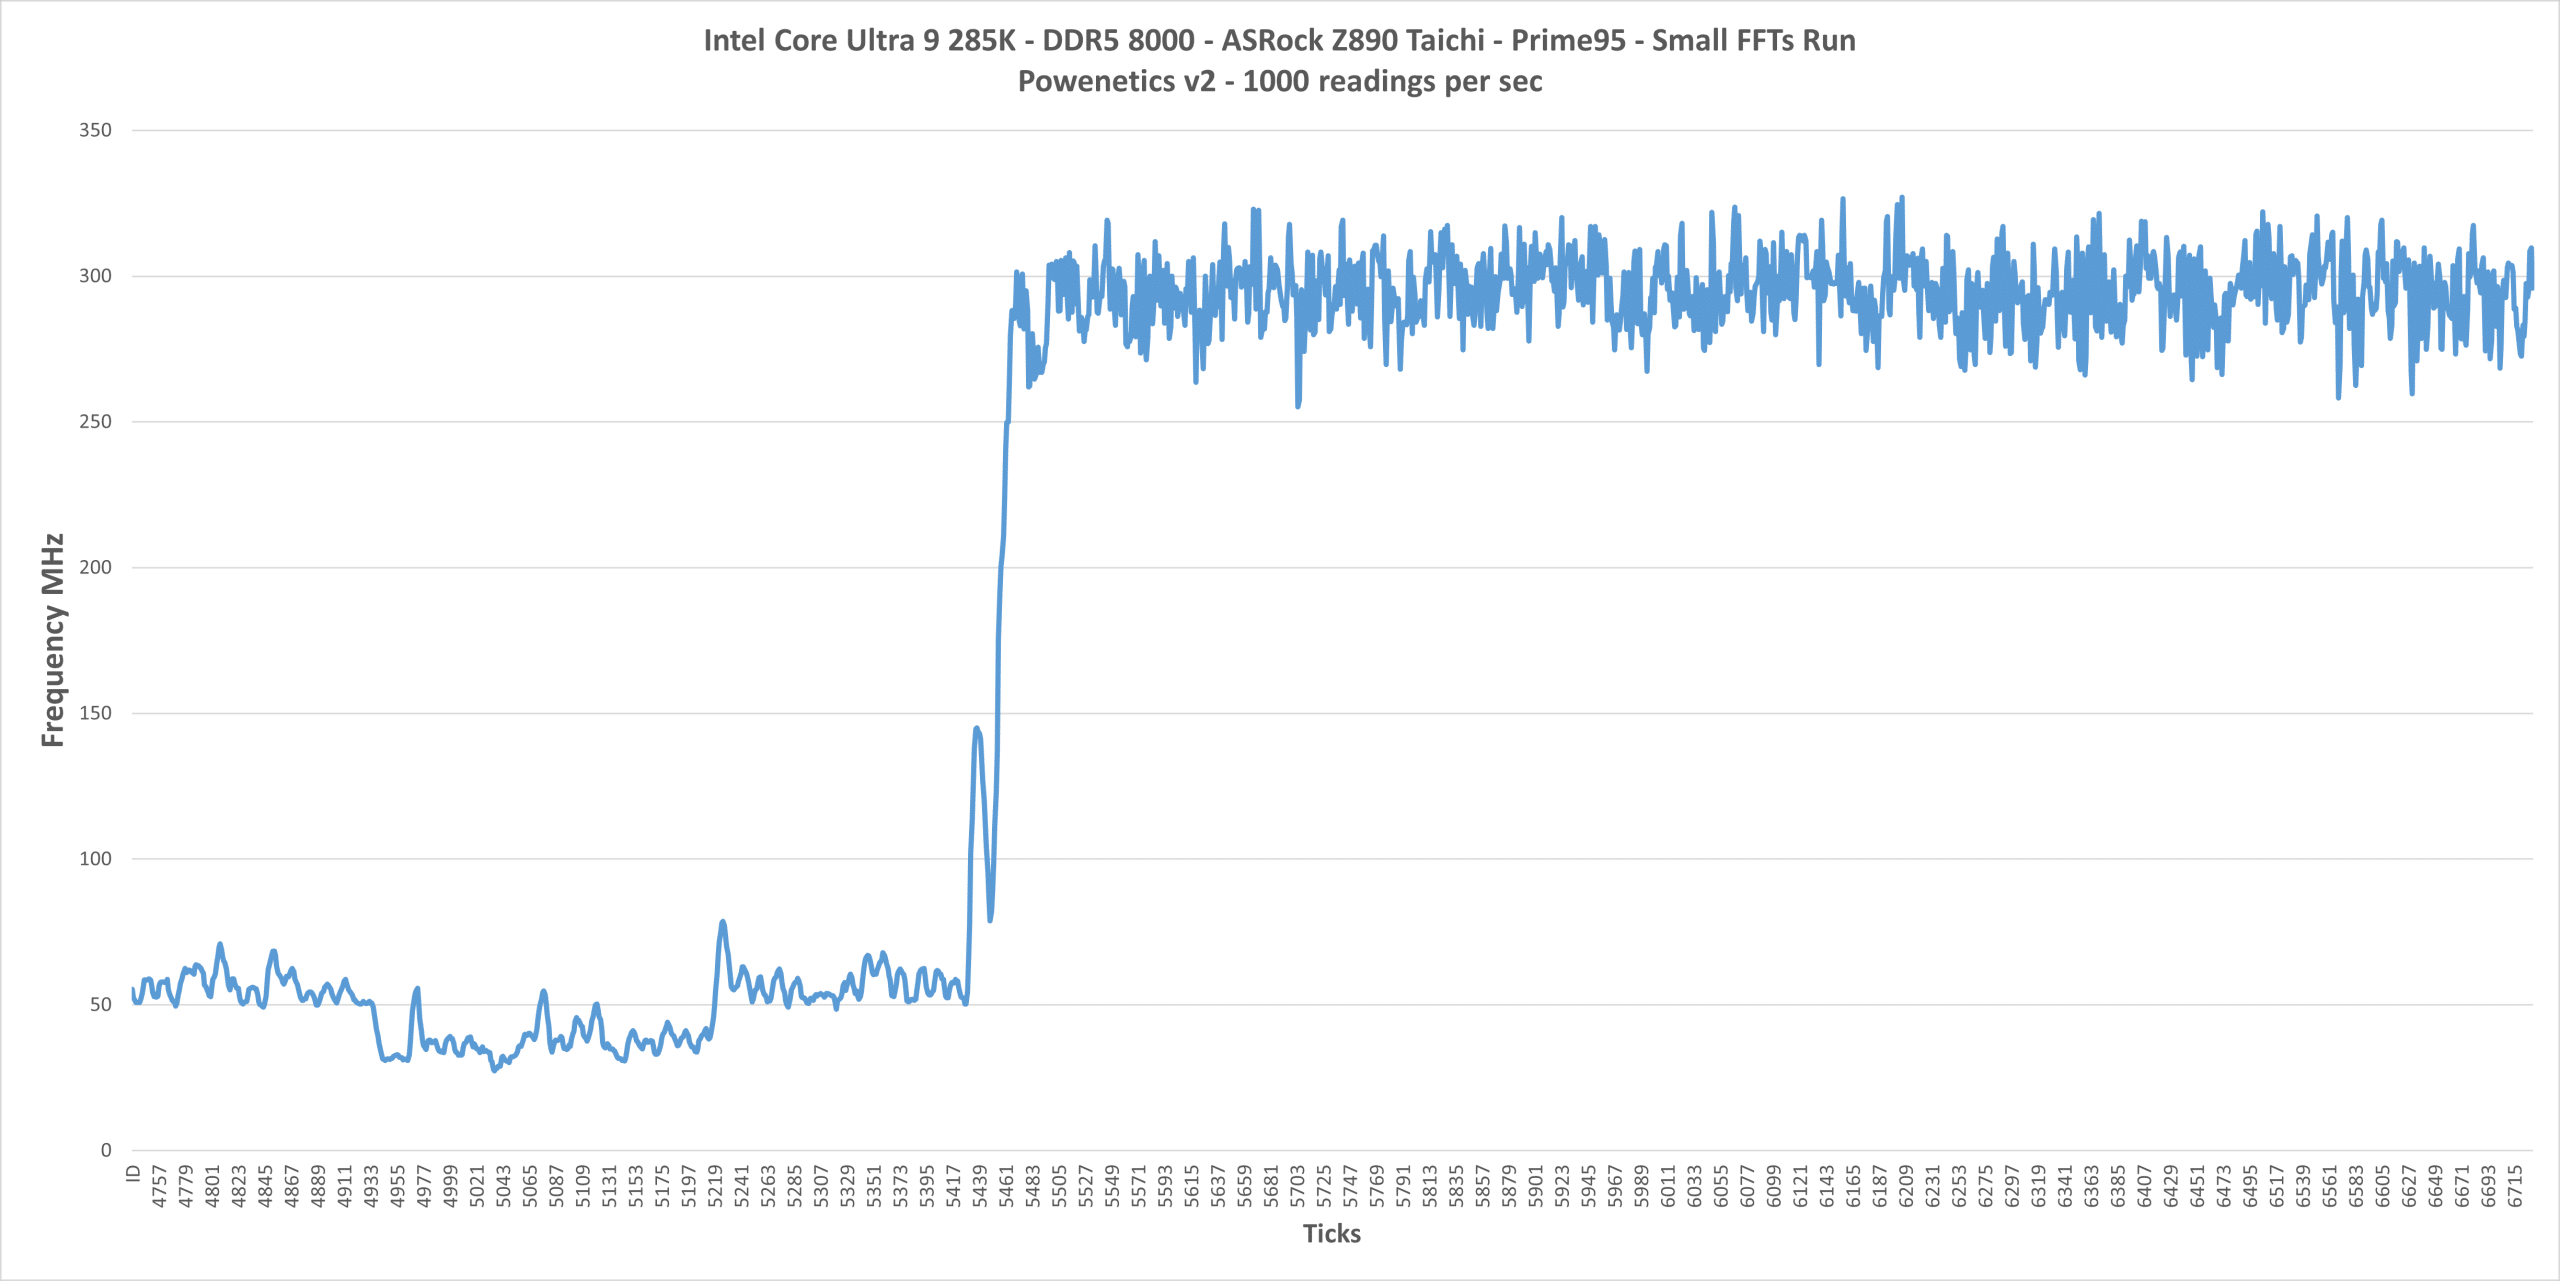
I use the Powenetics system to measure power consumption in every significant part of the mainboard, with up to 1000 readings per second.
In general, the faster RAM pushes the CPU to consume power power. Let’s examine the gaming scenario below:
| Gaming | |||
| DDR5-8000 | DDR5-6000 | ||
| CPU Frequency (MHz) – AVG | 4834.7 | 4832.12 | |
| CPU Utilization – AVG | 54.27% | 52.7% | |
| CPU Temperature – AVG | 59.61C | 59.01C | |
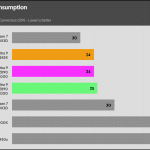
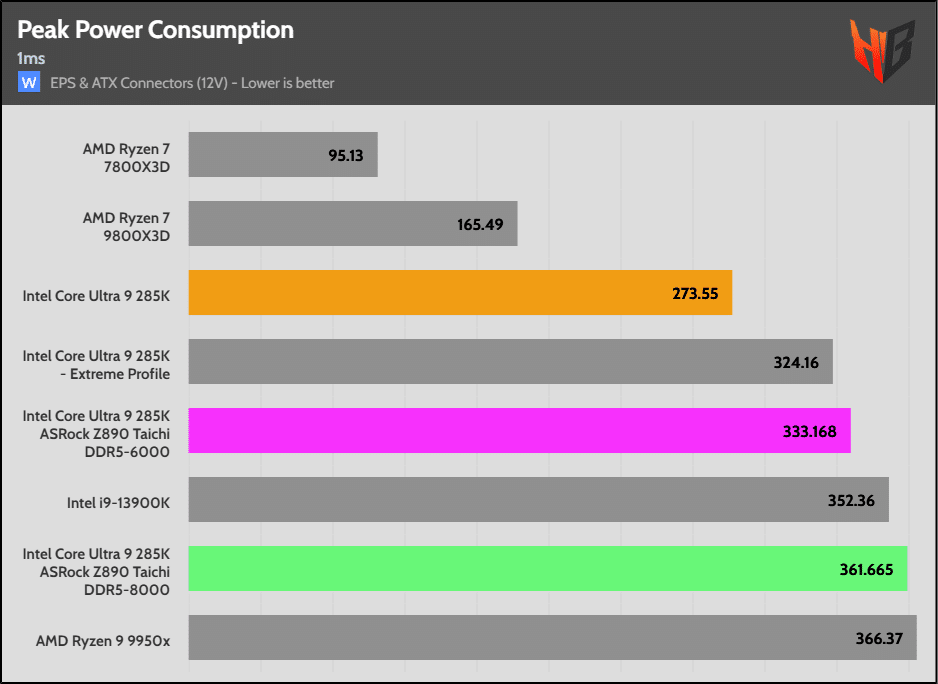
Peak Power Consumption
The ASRock mainboard’s peak power consumption is much higher. The different VRMs are to blame.
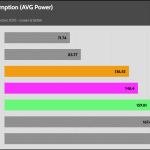
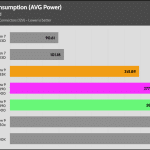
Power Consumption Graphs
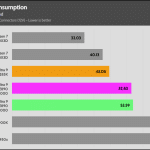
Energy Usage
The 285 K’s relatively low power consumption allows for high scores in the energy usage charts.
Pages:


Thanks for the tests, but I don’t like how you completly ignore the timings on RAM. It’s a little less imporant than speed frequency but still makes a difference. Also you didn’t write if the memory works in Gear 2 (1:2) or Gear 4 (1:4) (especially important with AMD).
It all matters.
For example, DDR5-7200 CL34-42-42-84 (1:2) is faster than DDR5-9200 CL42-56-56-134 (1:4)
He is running 6000 c40! I’m sure ASRock really appreciates that. And comparing against 6000 c32, so what are we even testing here? The 8000 cas is kind a weird too I can’t find a kit what with those timings, the cheapest 8000 kit is cas 38. Anyway.
Your power testing is the only one I see that show the INTEL idle higher than AMD. I think most other sites just take the reported readings and not the actual. Some show INTEL cpu as idle only 4-5 watts, which I don’t think my laptop even can do. Ridiculous! Thank you for measuring the actual power consumption.
This website needs better software for commenting.
No formatting is possible, no line break, no whatsoever. Where is BBcode for example?
The text was written nicely and readable but is now posted as an unreadable pudding without dots and comma.
Oh man!
sorry we use the standard WordPress editor.
More than enough, what is important is the quality content offered by the website.
If I were an interested buyer, personally I would still wait 3 – 4 months for Intels’ “magic” bios and driver updatest to appear (which were publicly marketed weeks ago to fix performance and whatever).
Personally I would NOT buy at all, because there is still a HUGE red flag: Intel execs/marketing refuses to answer if this Arrow Lake is the only CPU generation on this socket.
No, a silly refresh in late 2025 with + 5 % performance does not count.
https://www.tomshardware.com/pc-components/cpus/massive-dell-blunder-leaks-intel-and-nvidias-mobile-roadmaps-nova-lake-panther-lake-cpus-and-genxx-gpus-listed
The Deall leak from this year shows that next-gen Nova Lake architecture will arrive Q4 2026/Q1 2027 and will bring a HUGE update for core count, performance and efficiency.
Both P-cores and E-core will be doubled = 16 + 32.
Other rumors this year (job descriptions) have shown Nova Lake will be the bigget jump since the core architecture 2006.
This is all in line with amd next huge leap which is Zen 6, which will abandon the low-performance, unefficient chiplet-crap introduced with Zen 2, togehter with the ancient crap technology copper wire bonding.
https://www.youtube.com/watch?v=ex_gPeWVAo0
Zen 5 is still stupidly overpriced and ancient crap packaging technology. Looking at pro-accelerators as MI300 and reading information on some forums, shows there will be big updates for modern packaging.
Core count is also now rumored to double.
If Intel execs/marketing continue to refuse to answer if Nova Lake will also come for this socket, buying Arrow Lake and this platform is a very very very unwise decision.
Thanks for testing.
Your power consumption tests are the real deal. I see some very different results compared to the other more mainstream testers.
Looks like peak- & average power consumption for both applications and gaming is still not good.
Also good to see you are testing games in 720p resolution. Lots of other testers still test 1080p + maximum graphic testing and don’t want to admit to themselves that in quite some new games even a rtx 4090 bottlenecks.
Critique and improvement proposal is that you don’t specify how you test the games; build-in benchmark or own custom scene= Do it like the testers at pcgameshardware and test with CPU-heavy custom scenes.
Drop the CringeBench 6 benchmark and for media encoding, please add AV01 codec (av1 format).
I would also like to see some power consumption tests for low-utilization applications; so far you only have tested the extreme, which is 100 % utilization. You also don’t specify which applications were used for that.
Another tests showing the E-core performance would be good. Also disabling E-cores and doing some performance tests.
Thanks and good luck.