
Fan Performance: P-Q Curve
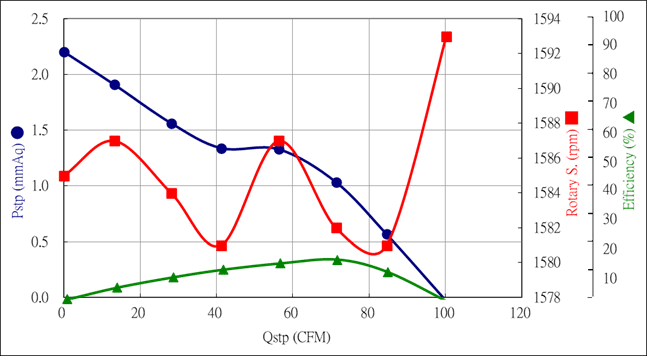
Regardless of its dimensions, every fan, whether DC or AC-powered, has a characteristic curve called P-Q. This curve shows the correlation between the fan’s airflow and its static pressure. The letter “P” describes static pressure, and the “Q” letter airflow.
When we refer to a fan’s airflow, we speak about the total amount of air the fan pushes or produces per unit of time. Airflow is usually measured in Cubic Feet per Minute (CFM). Fan manufacturers measure a fan’s CFM in an open environment without any obstacles in front of it, and this plays a huge role, as you will soon find out through our reviews. When there is no resistance in front of a fan, its airflow is at its maximum, but this is not the case for most fans, especially for those used in heatsinks and AIO radiators. Most of the fans that are used in chassis don’t face significant resistance.
The maximum static pressure is the fan’s wind pressure in a fully enclosed channel. Static pressure is the air pressure the fan can produce in an enclosure. It is measured in Pascals (Pa), inches of water (inH2O), or millimeters of water (mmAq). The most important thing you need to know is that the fan will not simultaneously output maximum airflow and static pressure values. Airflow and static pressure have a negative correlation. When airflow increases, static pressure decreases, and when static pressure increases, airflow decreases.
Both airflow and static pressure have to do with airflow resistance, called impedance. When parts block the fan’s airflow, we have impedance, so to find out the complete P-Q curves of a fan, we have to be somehow able to simulate this impedance. Some users use custom-made filters or AIO radiators, but these techniques only simulate a single impedance scenario, so they cannot offer complete P-Q curves. The only way to get the entire P-Q curve of a fan is to have variable impedance, which is what an instrument like the LW-9266 does, based on established measuring standards and with full calibration reports.


This rating system is actively encourages optimizations of paper specs that do not matter on any real applications, and would only worsen the overall quality of fans if manufacturers try to score well for this rating system.
As mentioned in this piece, the airflow rating is only measured at zero resistance. Meanwhile, the static pressure rating is measured when zero airflow is produced. Neither scenario ever occurs when the fan is attempting to cool something.
At the very least, the impedence curves of multiple standard obstacles should be measured, and the working point should be identified based on the P-Q curve, which can then be used as the basis for the rating. Certainly not with the current environments that do not remotely reflect real world usage. This is already ignoring many factors that are not considered, like close blade-obstacle interactions leading to differences between the estimated working point and actual airflow, different obstacles significantly changing on-application acoustics (differently for each fan), and differences in noise profile.
For the sake of the PC fan market, please reconsider your approach to this rating system.
We implemented this scheme after almost 2 years of hard work and over 100 fan evaluations. Let me clear this first.
Also, please read how the Longwin machine operates because it is tiresome for me to have to repeat that all over. Not real word usage? So 1-2 radiator tests, or 10x would suffice for you? What for the next 100s of them available on the market? Again, read how the Longwin can apply all possible loads.
Acoustics: I have been running acoustics tests for 15 years now. You tell me that I need to test under possible scenarios? Seriously? So I need to mount the fans in 1000 radiators to take all relevant measurements?
You try to pass your thoughts using several technical words, which I am not sure if you fully understand, but I don’t see you suggesting something practical. So please feel free to suggest something real, using plain words for everyone to understand, and we can discuss it. I am known for being always open to suggestions.
Please don’t get me wrong for my reply, if it is kind of harsh. But I busted my a@@ to make this happen and I did it after a LONG period of studying and experimenting. This is NOT a review methodology, but a certification methodology for which we will apply for an ISO 17025. So again, if you have any practical ideas and not a generic scenario and thoughts, tell me please hey Aris I think you can do that and that. And I will seriously consider it.
I appreciate your hard work, and you spending the money to get a known, reliable fan testing machine instead of building one by yourself that you cannot confidently say is accurate. That said, it does not mean your methodology is perfect. However, no, I am not telling you to throw all the data away.
Yes, I have a pretty good understanding on how the Longwin machine works. Two main chambers. Perforated plate stops airflow and allow air to diffuse through. Orifices of variable sizes allow air to pass through to the second chamber. Pressure in both chambers are measured. Pressure difference between the two chambers, alongside the area of orifice, are then used to calculate airflow. A variable exhaust system (essentially, a fan) simulates different impedence, allowing P-Q curves to be drawn.
My biggest gripe with your methodology is, perhaps, the fact that you constantly stress that the machine can measure P-Q curves, but you never actually look at the curves when evaluating the fans. You are only looking at the X and Y axis intersections and ignoring everything else!
Since you’re very familiar with PSUs, I’ll use them as an analogy. Fans working against different backpressure is comparable to PSUs working at different loads. Evaluating fans based only on max airflow and static pressure, is comparable to evaluating PSUs only based on their max load and idle performances. You do not evaluate PSUs that way; instead, when giving them a rating, you look across the entire range. This is the same for fans. You must evaluate them based on the entire performance range to give them a fair judgement.
P-Q curves can be useful estimations, even if they cannot 100% predict performance directly on obstacles. Or course, based on reasons I have stated in my first comment, P-Q curves alone cannot completely reflect the actual performance of PC fans. Still, you can make them useful. But first, you need to have an idea of the impedence of different obstacles.
Yes, you need to test a bunch of obstacles. Radiators of different sizes, thicknesses and FPI, hexagon vents, circular vents, slit vents, plastic filters, nylon mesh, metal filters, wire grills… No, you do not need to test every single one in the world, just enough to have a general idea. Just because you can’t feasibility test everything, doesn’t mean you shouldn’t try your best to draw a more complete picture. Select a few representatives that represent a wide range of obstacles the fans can potentially face. Test their impedence using the Long Win machine and validate whether the on-application airflow matches the predicted operating point well.
While it’s ideal to test directly on obstacles to account for on-application acoustics (which you really should try to do; yes detailed fan testing is hard work where you need to mount and unmount fans lots of times, though definitely not thousands so you need to pick a few), you can still draw good estimates based on P-Q curves. Based on your tests on the impedence of different obstacles, you can select a few representative impedences, and evaluate fans based on the predicted operating points based on the P-Q curves. So, instead of “Airflow” and “Static Pressure” ratings, you can also give the fans additional ratings based on their P-Q curves – say, “High Impedence”, “Mid Impedence”, “Low Impedence”. These values and ratings will be much more meaningful for real applications.