Relative Perf & Perf Per Watt (Raytracing)
- Alan Wake II
- Cyberpunk 2077
- Dragon Age: The Veilguard
- Ratchet & Clank: Rift Apart
- Resident Evil 4 RE
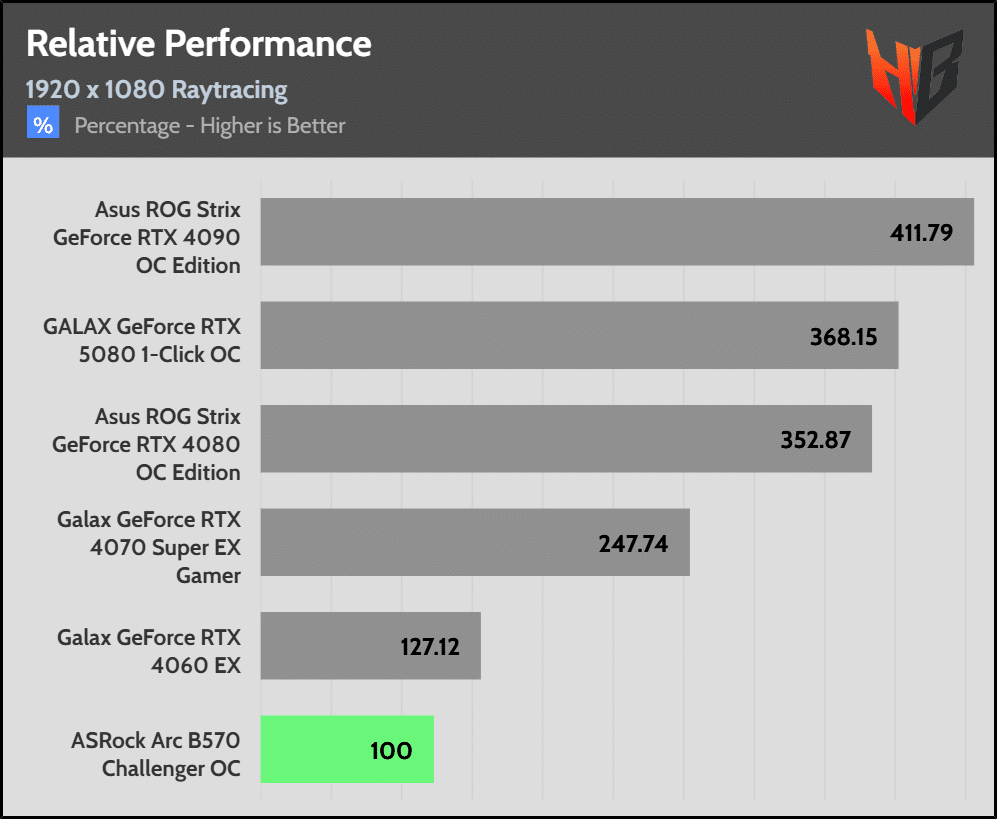
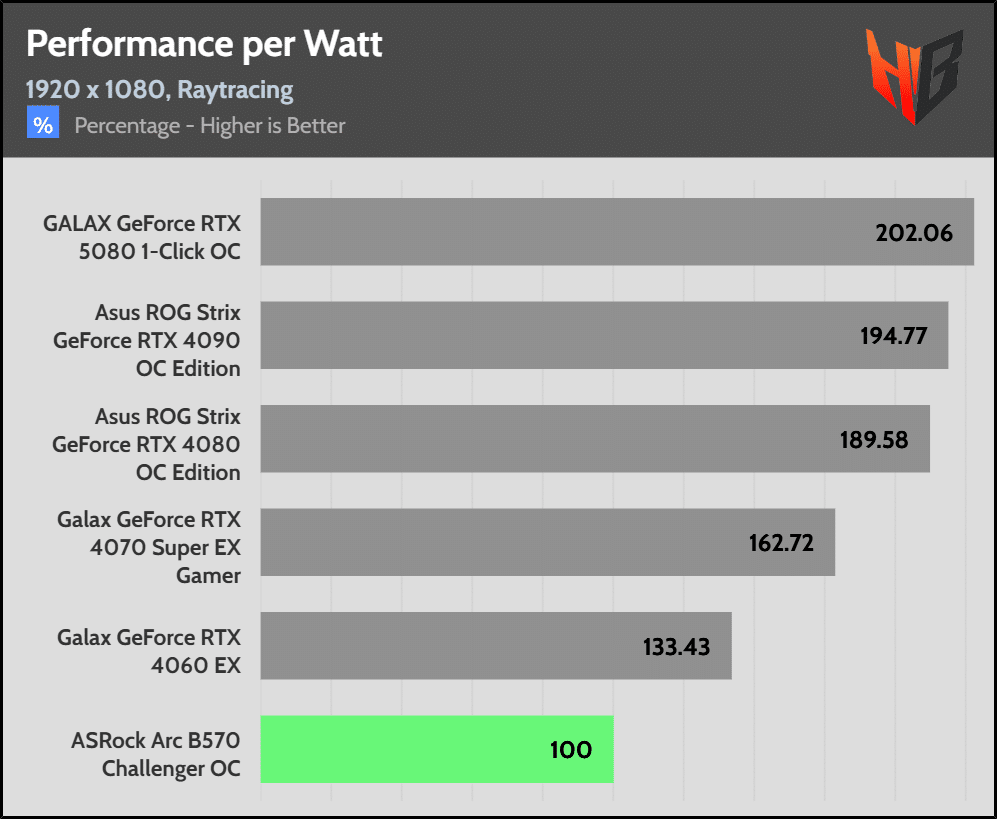
FHD (1920 x 1080)
 |
 |
The B570 stays behind the RTX 4060 for another one time.
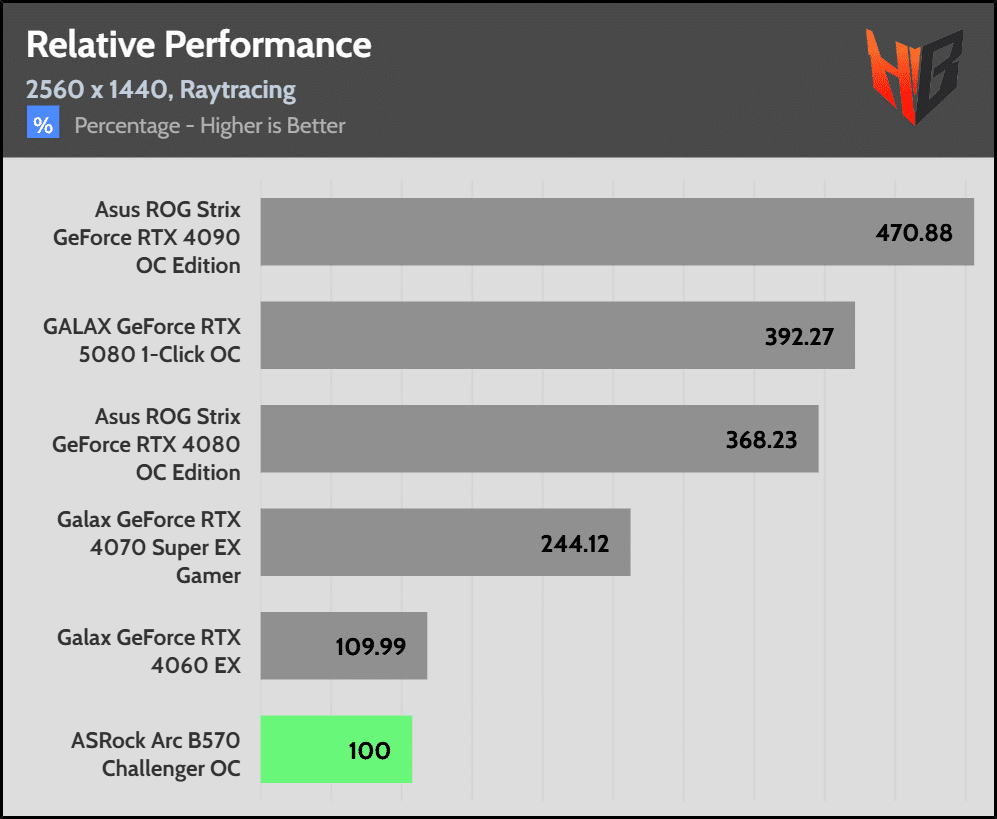
QHD (2560 x 1440)
 |
 |
At QHD, the performance difference with the RTX 4060 and the B570 is lower, but in performance per Watt the difference is notable.
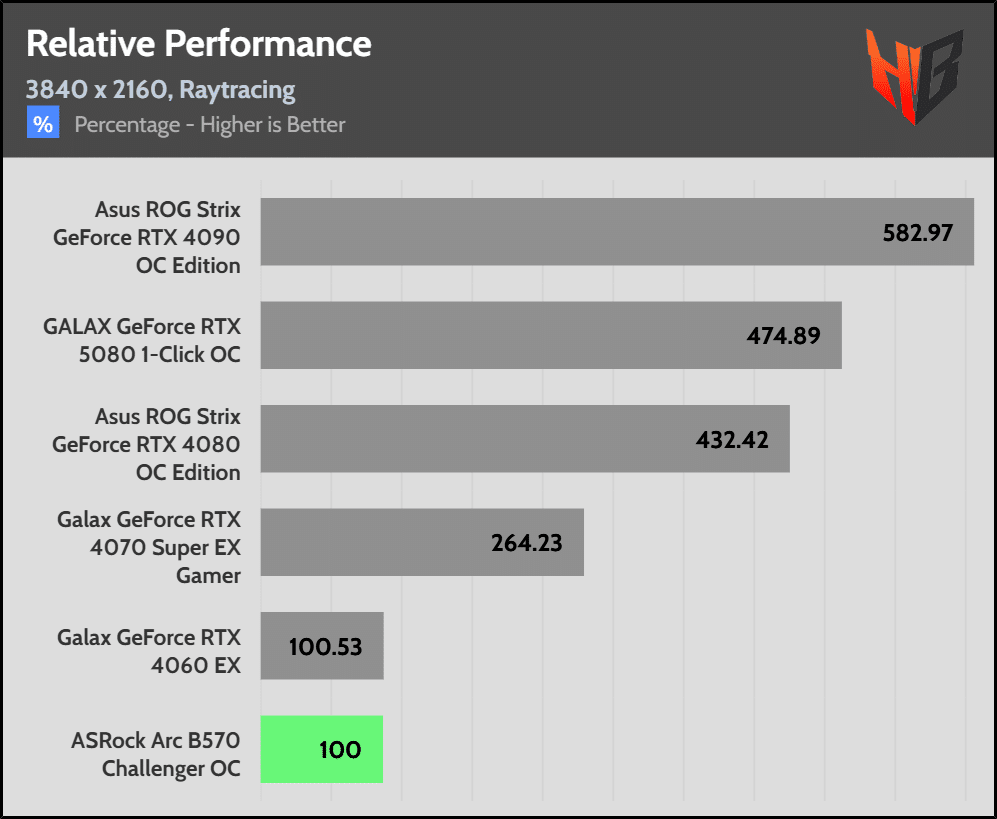
UHD (3860 x 2160)
 |
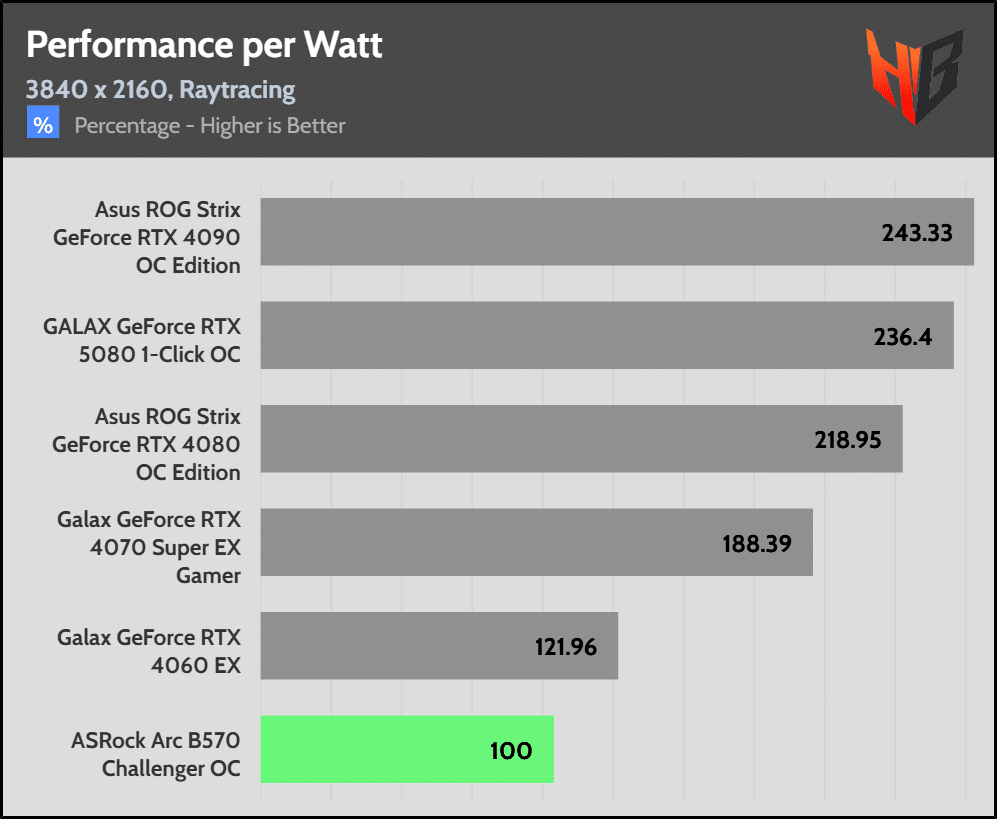 |
It’s almost a tie in performance because the increased VRAM of the B570 helps in some games. On the other hand, the RTX 4060 is clearly ahead in performance per Watt.
Pages:
- Prologue & Technical specifications
- Intel’s Key Technologies
- Box & Contents
- Part Analysis
- Specifications Comparison
- Test System
- Game Benchmark Details
- Raster Performance
- RT Performance
- RT Performance + DLSS/FSR/XeSS Balanced
- Raytracing Performance + DLSS/FSR/XeSS Balanced + FG
- DLSS/FSR/XeSS Balanced (No RT)
- DLSS/FSR/XeSS Balanced + FG (No RT)
- Relative Perf & Perf Per Watt (Raster)
- Relative Perf & Perf Per Watt (Raster + DLSS/FSR/XeSS)
- Relative Perf & Perf Per Watt (RT)
- Relative Perf & Perf Per Watt (RT + DLSS/FSR/XeSS)
- Relative Perf & Perf Per Watt (RT + DLSS/FSR/XeSS + FG)
- Rendering Performance
- Operating Temperatures
- Operating Noise & Frequency Analysis
- Power Consumption
- Clock Speeds & Overclocking
- Cooling Performance
- Epilogue