
ETA Energy Certification
Eta (uppercase “Η,” lowercase “η”) is the seventh letter of the Greek alphabet. The efficiency of a PSU is typically denoted by the Greek letter small Eta (η – ήτα). This is why I decided to call our efficiency certification program ETA. Initially, I used A, B, C, E, and F ratings. Still, soon enough, a good friend of mine, Walter, told me that soon enough, this certification would be dead because nobody would want to put on its box anything else but A, since even B in the US culture can be passed as fail. So, after a year or so, I followed the Metal ratings (Titanium, Platinum, Gold, etc.) with which people were already familiar. I just added a new top-level, Diamond, to provide a goal for all manufacturers and brands to improve the efficiency of their PSUs.

Remember, certification is not a review and it is voluntary, meaning that you cannot pressure manufacturers or brands to send you samples for certification. So, including too many factors in a certification, especially the ones relative to performance, can lead you sideways and cause you to lose track of your goal, which, in this case, is to improve the PSU’s efficiency. A certification’s goal is not to compare units and judge their performance; this is for reviews but to classify the PSUs in categories based on their performance in a specified area (efficiency or noise). This is why I didn’t include ripple or load regulation or other performance aspects in the ETA certification scheme, but I only included the factors that affect a PSU’s power consumption.
In every ETA certification, we thoroughly test the PSU, taking every possible measurement, not only the ones related to efficiency. We also include most of our data in the corresponding reports so users have a complete picture of the PSU’s performance. Moreover, we also check the protection features, which are of immense importance. When we find something we disapprove of, we inform the manufacturer to make the corresponding changes and return the sample for re-testing. We even reduced our testing fee to half for any re-test to help the manufacturers improve their products. Speaking of testing fees, I remember back in the day, some reviewers didn’t like that we charged a fee for every test. There is no other way since we have the equipment to buy and maintain and, of course, people to pay for who are the best in what they do. A laboratory’s expenses are enormous, especially if you follow strict procedures. The calibration of all necessary equipment is also a heavy but necessary burden.
The Average Efficiency Concept
While 80 PLUS only considers 3-4 measuring points, I thought I should check way more and take the average as the PSU’s efficiency score. This is easier said than done, but I can do pretty much everything with the corresponding equipment thanks to the software I developed over the past 15 years.
I will describe the Efficiency Measurements Procedure, quoting parts of the PSU Test Protocol I wrote and listed on the Cybenetics site.
Contrary to existing methodologies, which only take three to four measurements, we apply more than 1450 load combinations in the DUT. The whole procedure lasts about two and a half hours in total. The overall or average efficiency is the average of all measurements, covering the PSU’s entire operating range, except redundant PSUs, where we take 2-100% of the PSU’s operating range. This way, it is impossible for a manufacturer to tune its products to meet some specified load levels since, in essence, we consider the efficiency levels under a higher number of different load combinations evenly spread throughout the entire load range. Besides efficiency, we also take voltage, ripple, power factor, noise, and temperature measurements.
For ATX12V PSUs, we try to have at least 20 different load levels at 5V and 3.3V. At the same time, we also set an appropriate load step at +12V, which can deliver at least 1450 load combinations at +12V, 5V, and 3.3V in total. Finally, we apply a steady load of 0.6A at 5VSB while we don’t deal with the -12V, which is no longer required by the newest ATX spec.
In redundant and ATX12VO units with a single main rail and a standby one only, we increase the load on the latter rail by 1W. So, if this rail has a 15W capacity, we apply 15 different load levels (1W increase each time) while setting an appropriate load step on the main rail to allow for at least 1450 different load combinations.

Below in code form, is provided a description of the algorithm used to derive the load levels on the rails of an ATX12V PSU. A simpler algorithm is used for units with only two rails (main and standby).
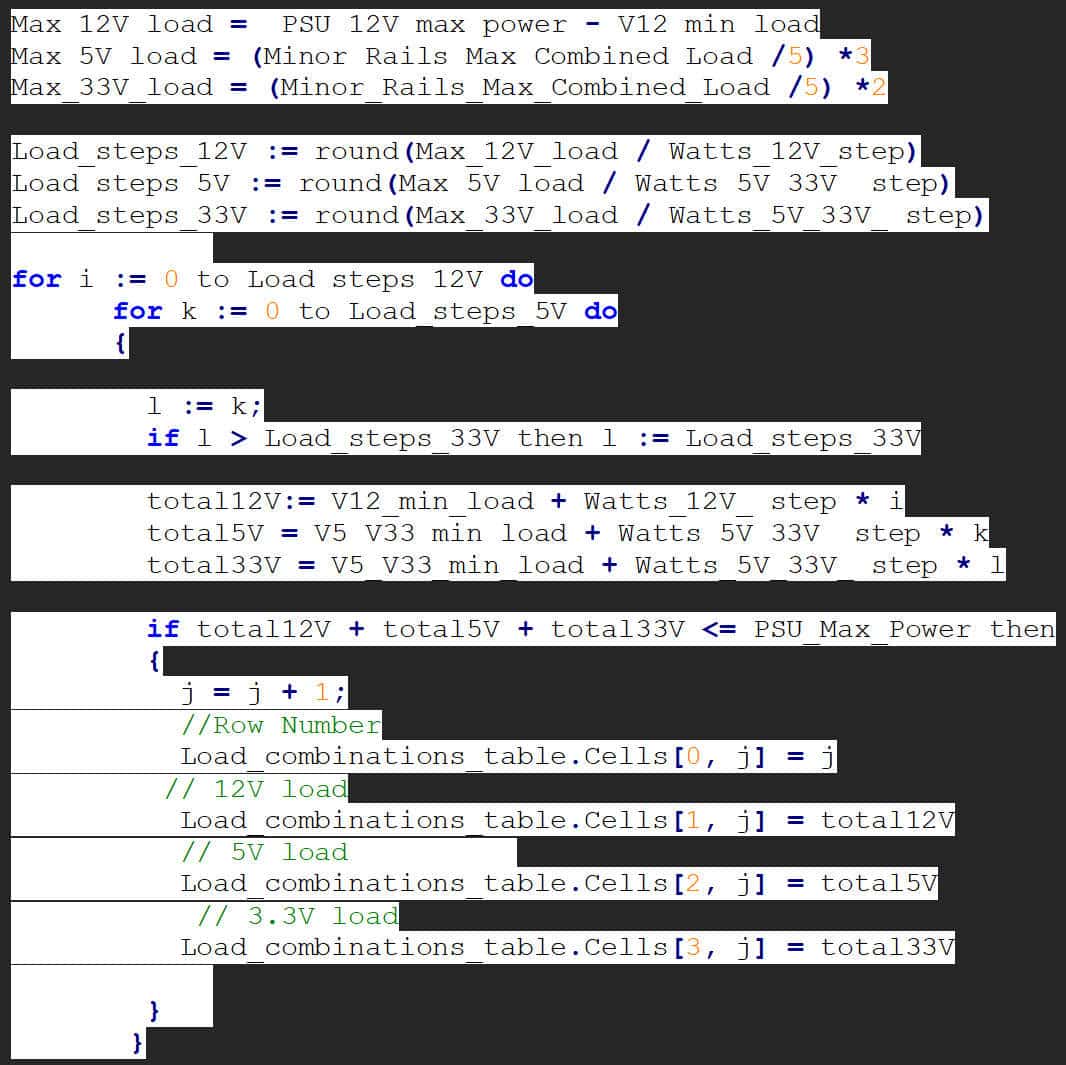
Our methodology’s massive data load allows us to modify our efficiency certification program quickly, should this be required.
Vampire Power
Vampire power (power consumption with no load on the 5VSB rail) is of high importance in ATX12V and ATX12VO units since all this amount of energy goes wasted, and most PC systems aren’t kept in operation 24/7, meaning that for a significant part of the day, the PSUs consume energy without doing anything useful. We evaluate each PSU closely following the EN 50564:2011 and IEC 62301 measurement guidelines. If the DUT doesn’t meet our standards, it will be automatically downgraded to the next lower efficiency certification level. The procedure is easy to follow if you have an advanced power analyzer. With the PSU installed on one of our load testers and powered through one of our AC sources, we have it in standby mode and run the corresponding application, automatically collecting all vampire power readings and providing us the full report in 15 minutes. During the process, if the TDH readings of the AC input go out of spec, the application renders the result invalid.
Standby Rail Average Efficiency
Besides all the above, ETA will also consider the average efficiency of the standby rail. We measure efficiency on this rail per 0.05 A steps up to its max current output, and the average of all measurements is the final efficiency result. Thus, we expect all PSUs to deliver over 70% average efficiency output on this rail, with this threshold set even higher for units that fall into the top categories of the ETA program.
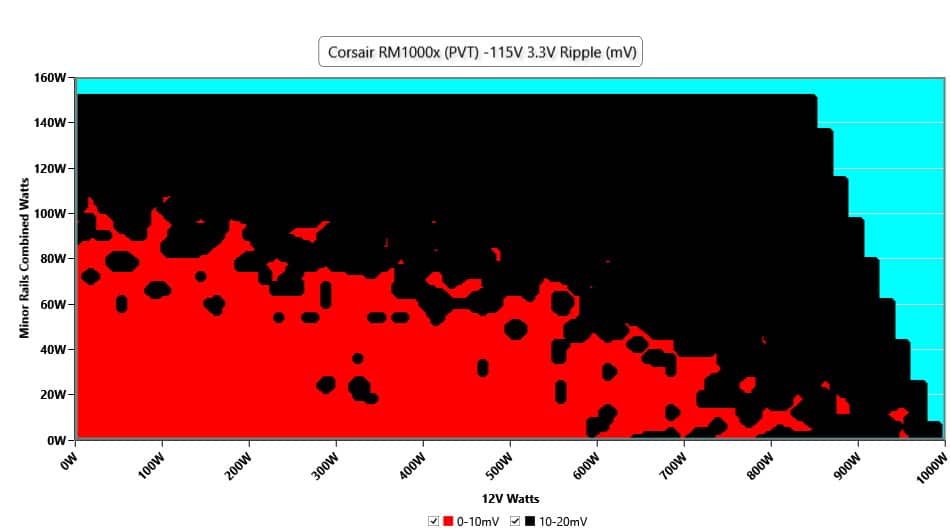
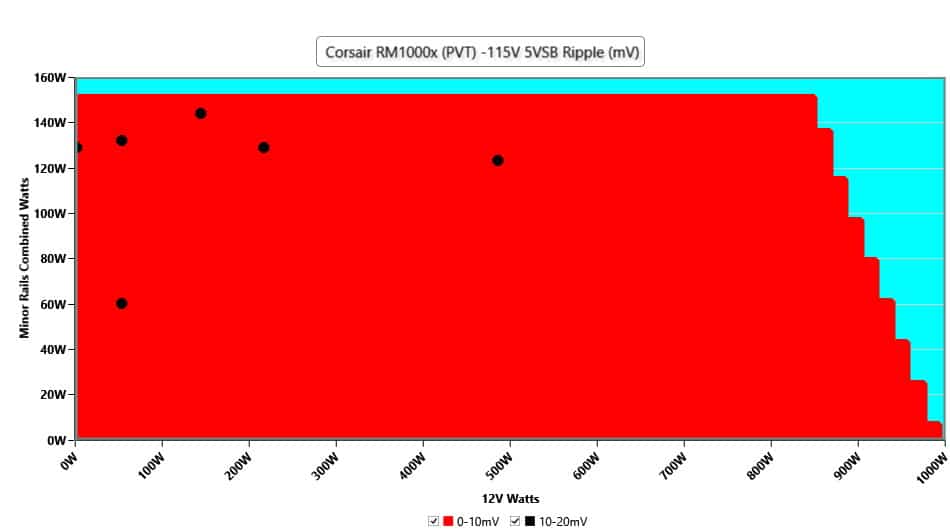
Average Efficiency (and not only) Graphs – An Example
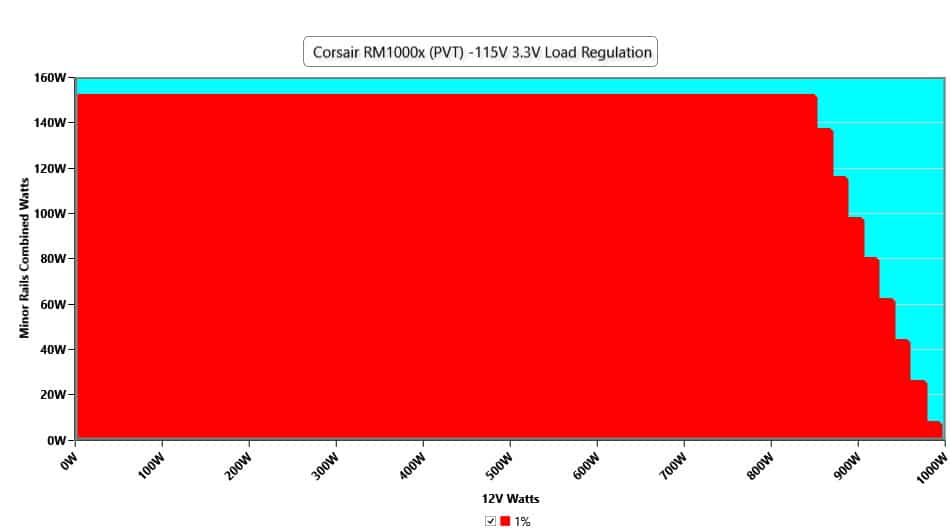
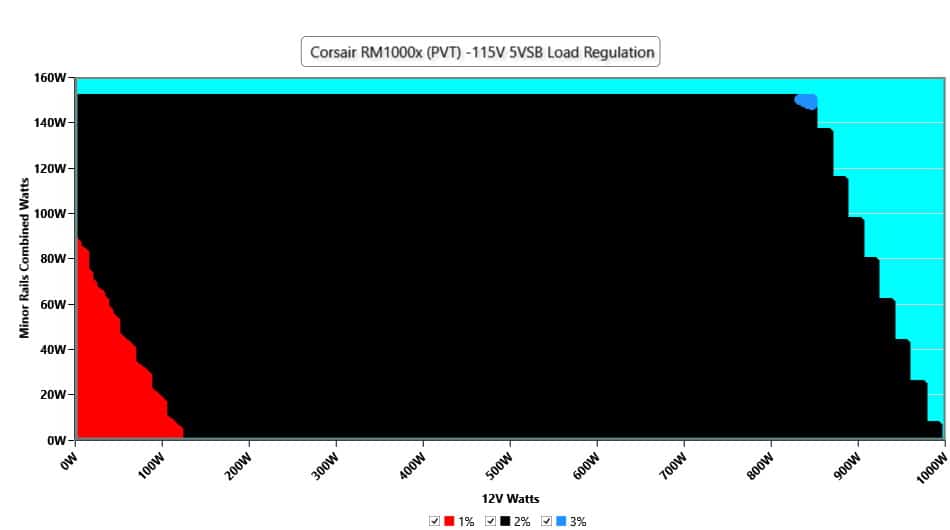
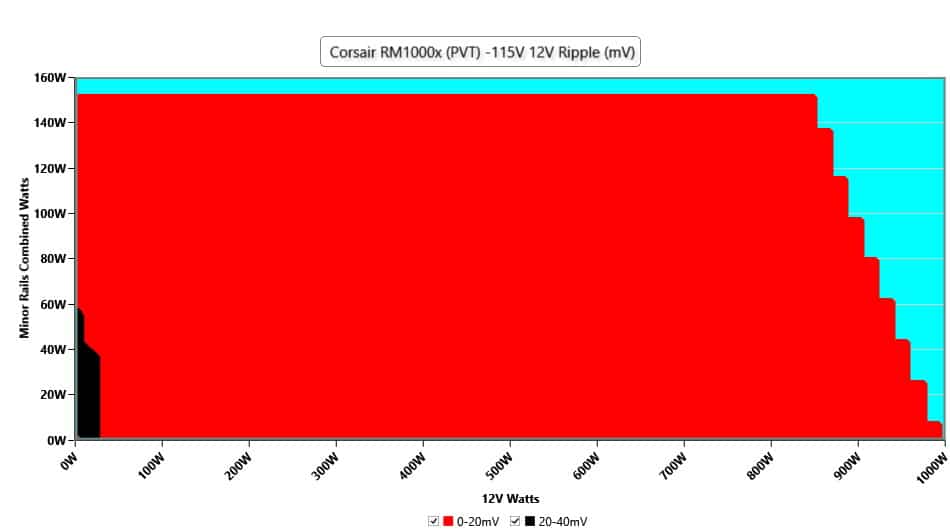
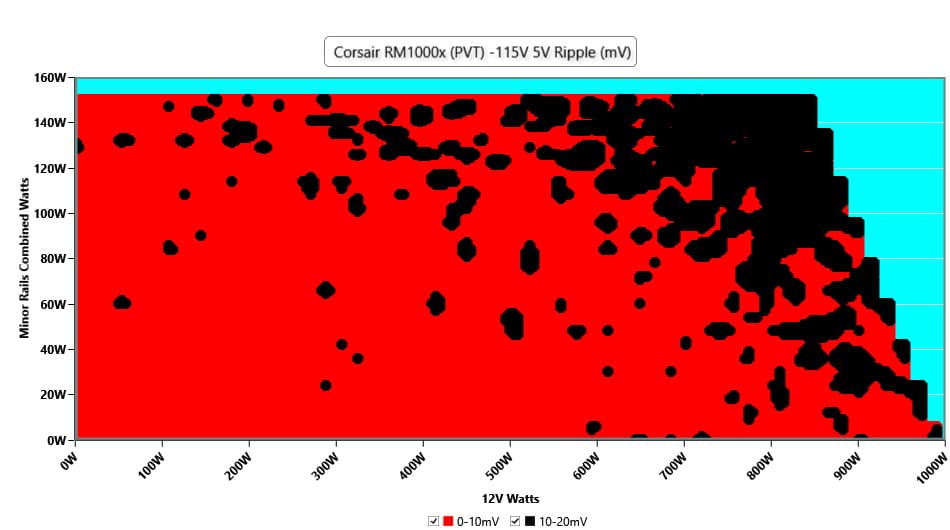
I used the Corsair RM1000x (ATX v3.1) results for the following graphs.
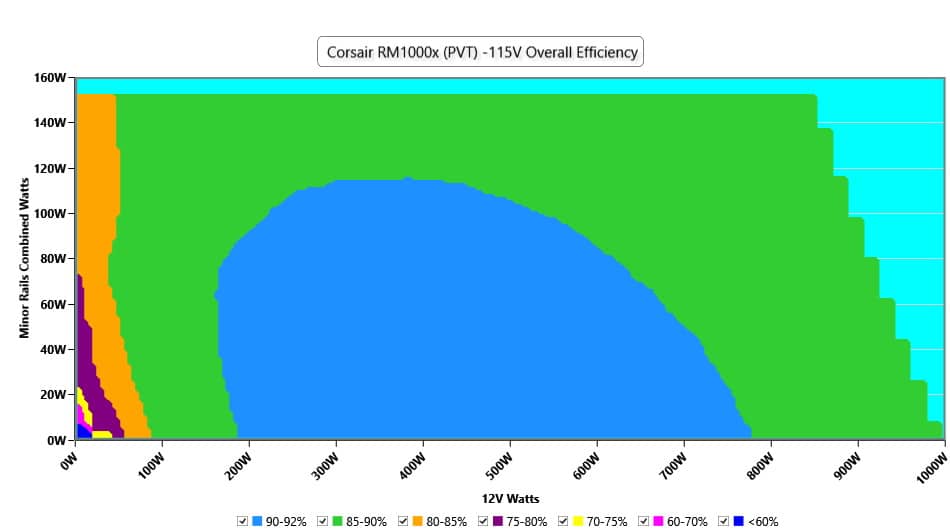
Using 1450 different load combinations and then interpolating them to increase the number to 24000 results, we have the following graph, which depicts the PSU’s entire efficiency map throughout all possible load combinations. As you can see, efficiency is in the 90-92% range in the 190-780W range, with the load on the minor rails not exceeding 110W.
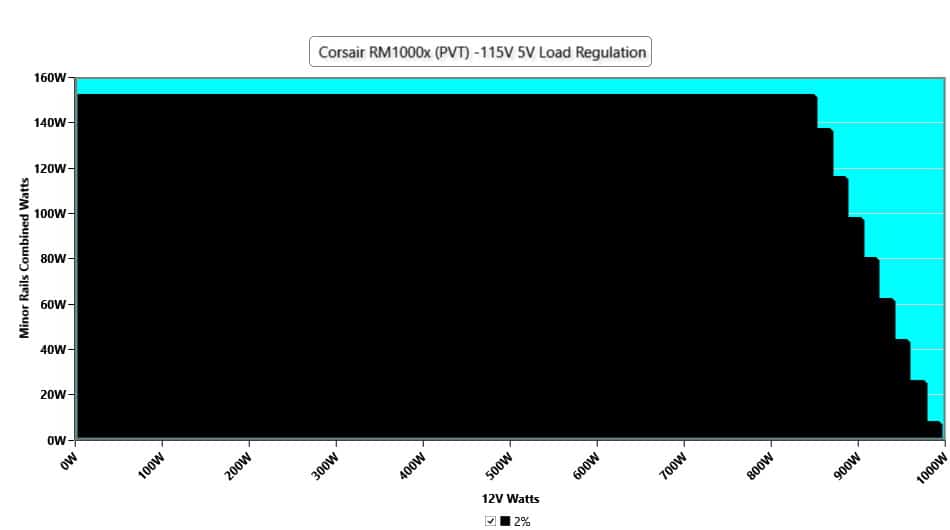
Besides efficiency, we get similar graphs for load regulation and ripple suppression on all rails, and the raw data includes everything else, from power factor readings to output temperature readings.


The Cybenetics badges are the first certification that’s honestly useful to me, something I trust. The openness and published data are unmatched in the consumer space (for PSUs at least). I read both this and the older article over at Tom’s now. They both contribute to the latter.
I remember the explanation – kinda endorsement – by your former colleague Igor. I was cautiously sceptical then. Like what, yet another certification programme? Another man in the middle to collect royalties? No. You are providing a genuine service to consumers and customers, I hope the wider industry fully recognizes this too. You’ve long reached the level where I’d ask “is there a way to donate” even if this is a commercial enterprise. Otherwise I wouldn’t have cared enough to read both articles! 😉
Thank you for your kind words! Posts like this give us strength to move on 🙂
Από το thelab?!
Με πηγές πολλά χρόνια πίσω. Διάβαζα τότε τα ποστ (στο worklog?) και το θαύμαζα.
TheLab ναι και δεν μπορώ να θυμηθώ δυστυχώς το πρώτο site που έστειλα άρθρο το 2000.
Hi Aris and team,
As a PC building lover, cybenetics and hwbusters have been a great help for me and other people I have recommended to, especially on your PSU reviews and Fan Case reviews.
I just know this website and channel not long ago. Looking up for a proper, standardized, and comparable data sheet from a 3rd party is not something you can find easily for a PSUs. Since I already dive deep into this hwbusters and cybenetics I’ll try to spread the words to some other community I know.
Thank you!