What is the difference between Error and Uncertainty?
These two are entirely different, so it is worth writing some lines to explain this.
- Error refers to the difference between a measured value and the true value. It can be due to mistakes or limitations in measurement, and it can be either systematic (consistent and predictable) or random (unpredictable).
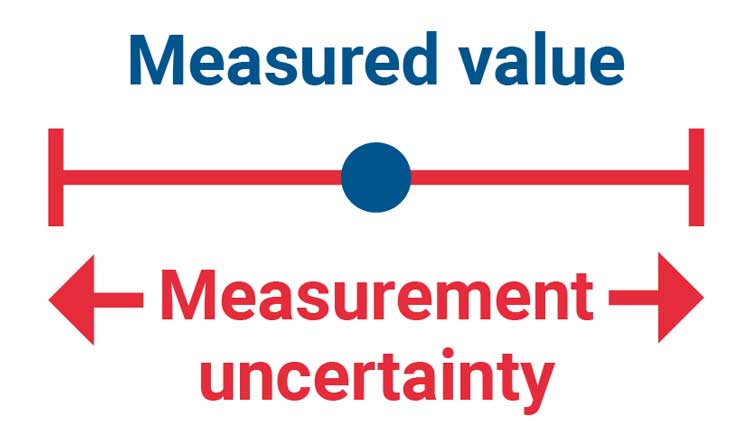
- Uncertainty is the level of doubt that we have about a measurement result.
In short, uncertainty is the expected range of possible values, while error is the difference between the measured and actual values.
We correct errors by calibrating our equipment to meet the original standards and perfecting or inspecting the measurement procedures. That said, if we don’t know how significant our error can be, for example, if we use uncalibrated equipment, we don’t know how far it is from the true values/readings; thus, we cannot add the corresponding entry to the uncertainty level. This is why it is a requirement for every lab to have calibrated equipment; otherwise, the uncertainty level cannot be calculated correctly!
Accuracy vs. Uncertainty
Accuracy refers to how close a measured value is to the true or accepted value. Uncertainty refers to the amount of error or variability in a measurement, indicating how much the measured value might differ from the actual value. In short, accuracy is about correctness, while uncertainty is about reliability or confidence in the measurement.
Multiple Measurements for more accurate results?
There is a saying, “Measure twice and cut once.” This means that when you need to cut something, whatever that is, you typically measure multiple times to be sure before you proceed with the cutting procedure. This is the law among craftsmen! The same applies to most measurements that we take. We run three to five measurements to see if they are at the same levels and isolate a possible error if something goes wrong during the measurement procedure. So, if we see a test result (reading) that is way higher or lower than the rest, we know we should ignore it.
When you get multiple measurements, you use two statistical tools:
- Arithmetic mean
- Standard deviation
The arithmetic mean, often called the average, is calculated by adding all numbers in a data set and dividing by the count of numbers. For example, the arithmetic mean of 2, 4, and 6 is (2 + 4 + 6) / 3 = 4. It is usually shown by a symbol with a bar above it (e.g. ). Needless to say, the more readings you get, the more precise the average will be, but at some point, you lose precious time without a significant increase in accuracy.
Deviation of Results
I know it’s frustrating when we measure the same thing repeatedly and get different results, but we can still use these results to check how widely spread the readings are. This spread can help us calculate the measurement’s uncertainty. The larger the spread, the higher the uncertainty, and vice versa.
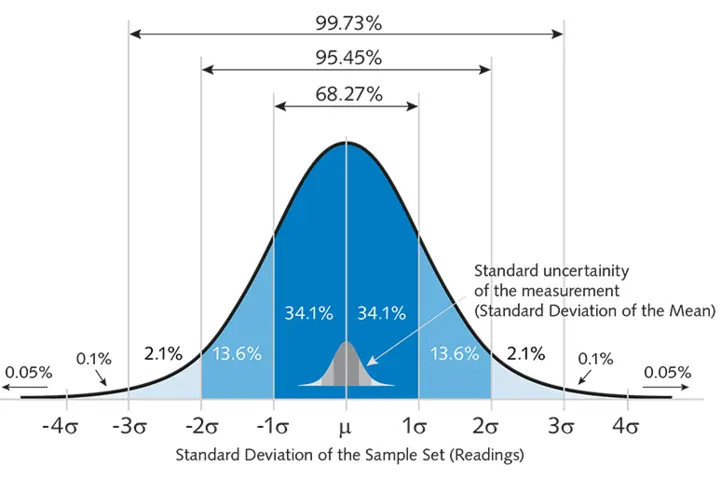
Measuring the distance between the top and bottom values is not enough in most cases. We need the Standard Deviation (SD), a measure of how spread out or dispersed the values in a data set are. A low SD means the values are close to the mean (aka the average value of all readings), while a high SD means they are more spread out.
There is a “rule of thumb” that states that 68% of all readings will fall between plus and minus one standard deviation (covering values within one unit above and below the mean). In comparison, 95% will fall within two standard deviations (covering values within two units above and below the mean).
To find the actual standard deviation value, we have to have a vast set of readings, which is impossible in most cases. So, from a decent/moderate number of values, we can only estimate the standard deviation, which is denoted through the symbol “s.”
Needless to say, the more values we have, the more accurate the standard deviation calculation.
Distribution Patterns
The deviated values can fall closer to the average/mean than far from it. This is called a normal or Gaussian distribution. On the other hand, when the readings are evenly spread between the highest and lowest values, we call it a uniform or rectangular distribution. Other distributions also exist but are beyond the scope of this article.


Have you participated in any inter-laboratory comparison (ILC) or proficiency testing to validate the accuracy of your methods? If not, do you have plans to?
We just finished EMI PT testing, and I am waiting for noise testing PT to begin.
We cannot find any PTs for efficiency and fan performance, so we will coordinate something with a manufacturer. The ISO provides this capability if you cannot find a PT category. We frequently also compare our results with those of the factory and other labs, but as you know, the 17025 asks for PTs and not just any lab.
Now your laboratory is accredited, and you have an ISO/IEC 17025 certificate? You might be the first hardware reviewer who is legitimate.
Our lab works under ISO 17025 for quite some time now. We have our system implemented several years ago, based on our knowledge and through some external consultants we hired.
We will have the first inspection in the following months, and we also applied for ISO 17065 which will allow Cybenetics to enter Energy Star. We would obtain 17025 years ago, but we moved the lab 2x times in the last two years. Now that we bought the damn building, we go full speed to it!
To get ISO 17025, you must operate for at least six months under this ISO’s guidelines. We operate for many years under that since this is the way.
This kind of ISO I am afraid is NOT for reviewers because it is too complex, too expensive and requires a crazy tight system. If there wasn’t Cybenetics I would never be able to even think of it. Basically Cybenetics gets it. HWbusters just uses Cybenetics data 🙂
Into this year we will get the cert, we DONT have it yet. We filled the application in December 2024 and we are waiting for the first pre-inspection in the next month (hopefully). My goal is to have both ISOs within 2025 (17025 and 17065)
Wow! Impressive