The BigReadings Window
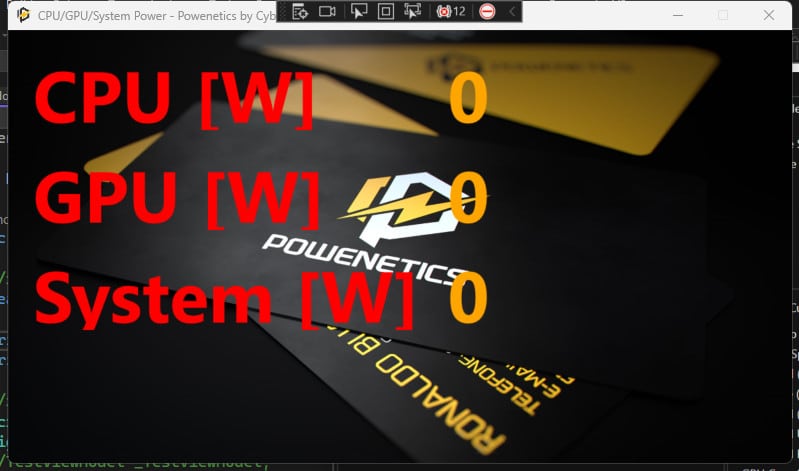
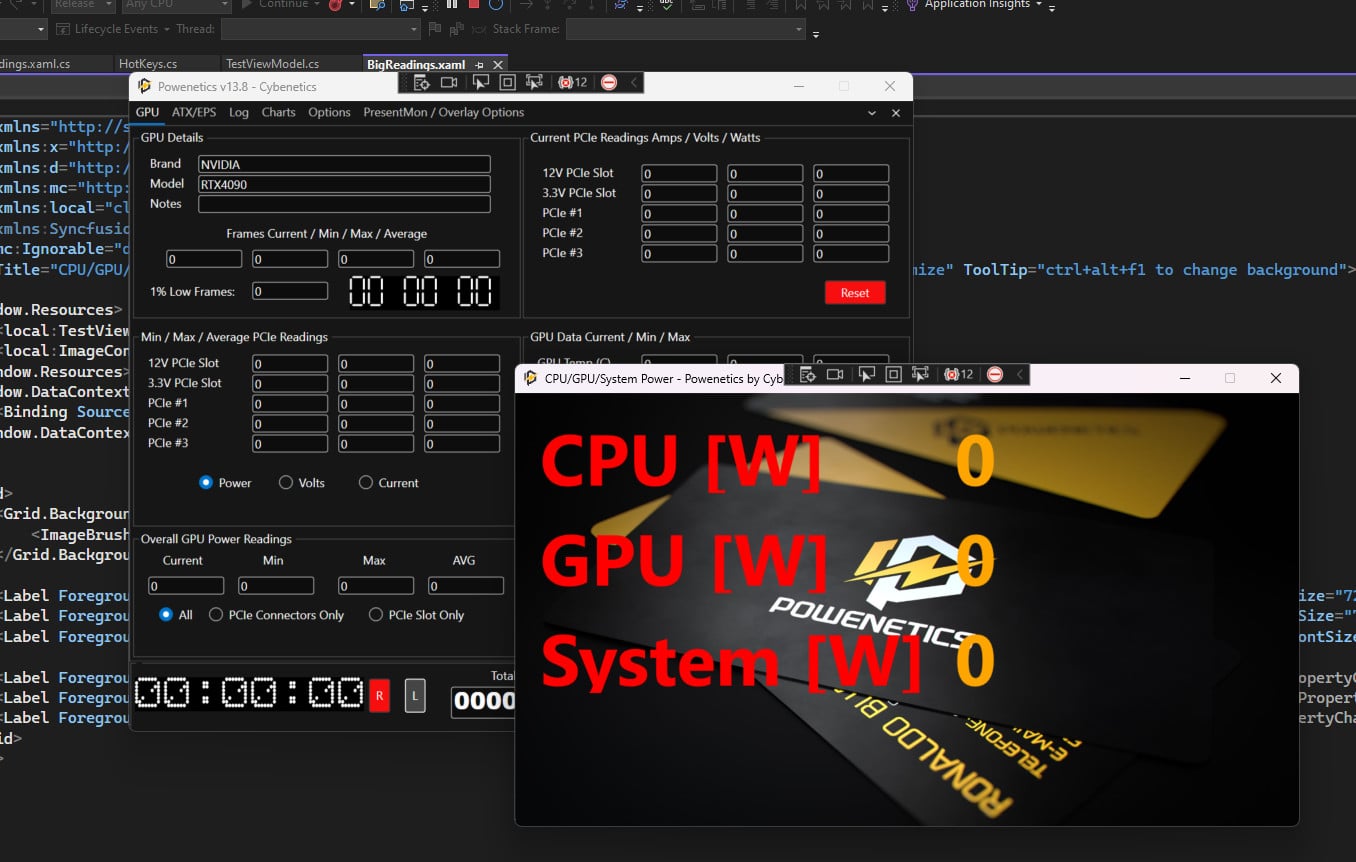
I won’t stand more in the C#, WPF, and MVVM combo since there is so much information online. So let’s cut to the chase. Since I will have the powenetics running on XPG’s booth in Computex, I wanted to make it easier for visitors to look at the critical data, CPU, GPU, and system power consumption. I needed an extra Window to provide this data in larger fonts to achieve this. Not only I wanted larger fonts, but I also wanted a nice background image, or why not images? I know I want a lot, but I cannot help it when programming is involved.
Implementing the new window and having the CPU, GPU, and System power readings show is a piece of cake.
I threw a new “button” in the MainWindow, and its Click code is the following:
private void Big_Readings_Click(object sender, RoutedEventArgs e)
{
bool window_active = false;//to find all window instances and allow for only one to be open
foreach (Window window in Application.Current.Windows)
{
if (window.Title == “CPU/GPU/System Power – Powenetics by Cybenetics”) { window_active = true; }
}if (window_active == false)
{
BigReadings win2 = new BigReadings(true);
win2.Show();
}
}
I don’t want two instances running simultaneously, so I had to ensure that the “Big Readings” window is not already open once the user hits to show it. In the XAML side of this window, which I call “BigReadings,” I put three labels and another three with some special binding code:
- <Label Foreground=”Orange” Content=”{Binding CPU_Power_PMD, Source={x:Static local:MainWindow.Real_Time_Measurements}, UpdateSourceTrigger=PropertyChanged}”/>
- <Label Foreground=”Orange” Content=”{Binding GPU_Total_Power, Source={x:Static local:MainWindow.Real_Time_Measurements}, UpdateSourceTrigger=PropertyChanged}”/>
- <Label Foreground=”Orange” Content=”{Binding Total_Power, Source={x:Static local:MainWindow.Real_Time_Measurements}, UpdateSourceTrigger=PropertyChanged}”/>
See how easy to show the readings? I have the Real_Time_Measurements class, so I only need to bind the readings I want to show to the corresponding values. If I want to show the average, max, or min values instead of Real_Time_Measurements, I will use Average_Measurements, Max_Measurements, or Min_Measurements.